Yves here. Just when the Fed thought it might have killed the economy enough for it to lower rates, groaf is back! Mr. Market still believes that at least one cut before this year is in order. But investors have had a way of getting considerably ahead of what the central bank is ready to do.
By Wolf Richter, editor at Wolf Street. Originally published at Wolf Street
Our Drunken Sailors are back at it, but in moderation, so to speak, their feathers largely unruffled by interest rates.
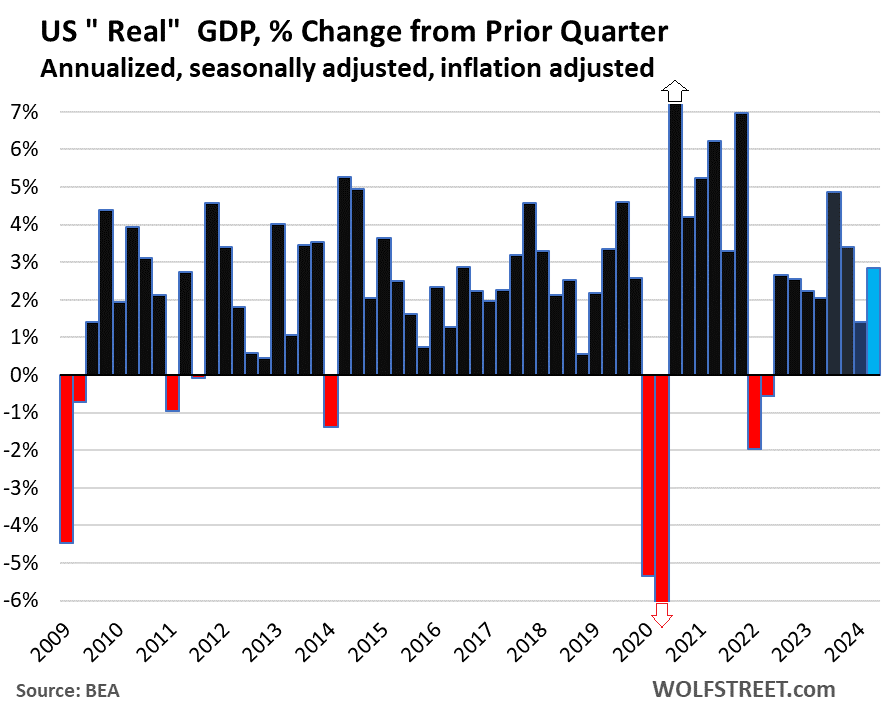
GDP, adjusted for inflation (“real GDP”), rose by an annualized rate of 2.8% in Q2 from Q1, doubling the growth rate in Q1 (+1.4%), according to the Bureau of Economic Analysis today.
By comparison, the 14-year average annual growth rate is 2.2%. So the 2.8% growth rate is well above average, and pretty good for the US economy.
We said at the time of the feeble Q1 release (+1.8%, now revised down to +1.4%) that it was driven by a “blip”: a decline in federal government consumption and investment, which turned out to be correct, it was a blip, it bounced back in Q2 (+3.9%), as we all knew it would because the drunken sailors in Congress are not suddenly slowing down.
- Consumer spending (69% of GDP): +2.3%, on a 4.7% surge in spending on durable goods (motor vehicles, recreational vehicles, household durable goods, etc.). Services +2.2%; nondurable goods +1.4%.
- Gross private investment (18% of GDP): +8.4%, amid an 11.6% surge of investment in equipment and a 1.4% decline in residential fixed investment.
- Government consumption and investment (federal, state, and local, 17% of GDP): +3.1%, after the 1.8% increase in Q1. Federal government +3.9%; state and local +2.6%.
- Change in private inventories investment added to GDP growth in Q2 after dragging on GDP growth in Q1.
- Trade deficit worsened by a big chunk for the second consecutive quarter, on surging imports to meet strong US demand for durable goods. Imports drag on GDP.
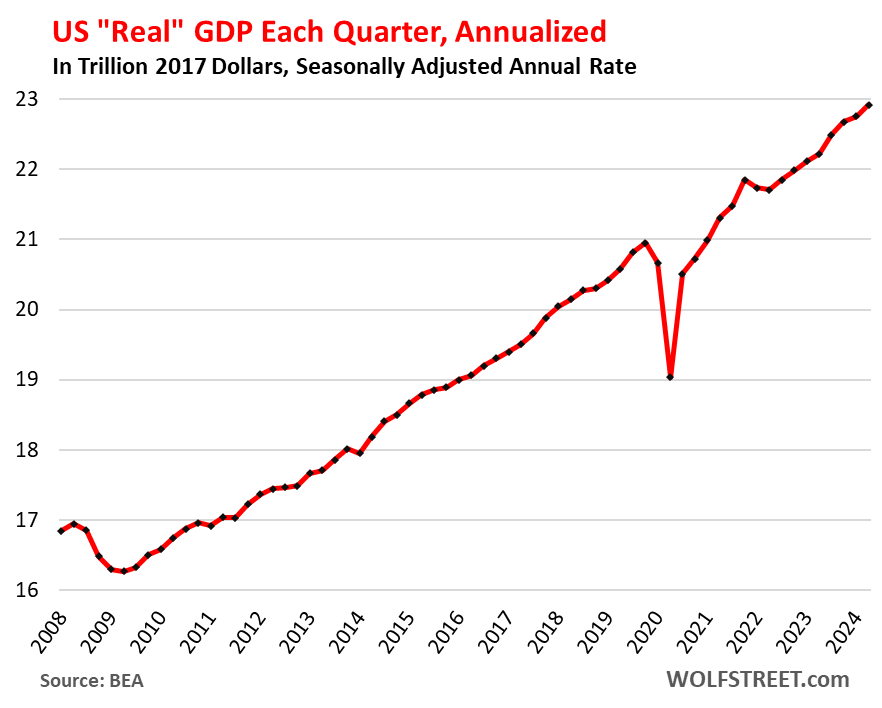
The actual size of the US economy: “Current-dollar” GDP (not adjusted for inflation and expressed in current dollars) rose by 5.2%, to $28.6 trillion annualized.
This $28.6 trillion of current-dollar GDP represents the actual size of the US economy, measured in today’s dollars, and is used for the GDP ratios, such as the US debt-to-GDP ratio.
“Real” GDP in dollar terms, adjusted for inflation and expressed in 2017 dollars, rose to $22.9 trillion annualized in Q2:
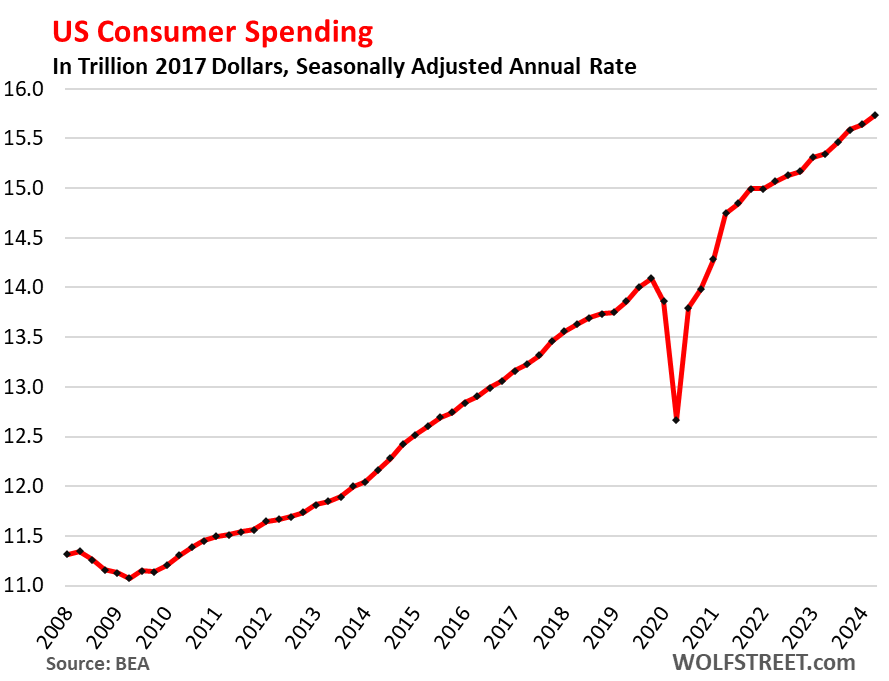
Consumer spending on goods and services rose by 2.3% in Q2 from Q1 to $15.7 trillion annualized and adjusted for inflation, an acceleration from the Q1 growth rate of 1.5%. In Q2, consumers re-stepped on the accelerator.
- Services: +2.2%.
- Durable goods: +4.7% (after the 4.5% drop in Q1), driven by motor vehicles, household durable goods, and recreational vehicles and goods.
- Nondurable goods: +1.4% (after the 1.1% drop in Q1), with increases in food, beverages, and gasoline, and a decline in clothing and footwear.
Our Drunken Sailors are back at it, but in moderation, so to speak, their feathers largely unruffled by higher interest rates:
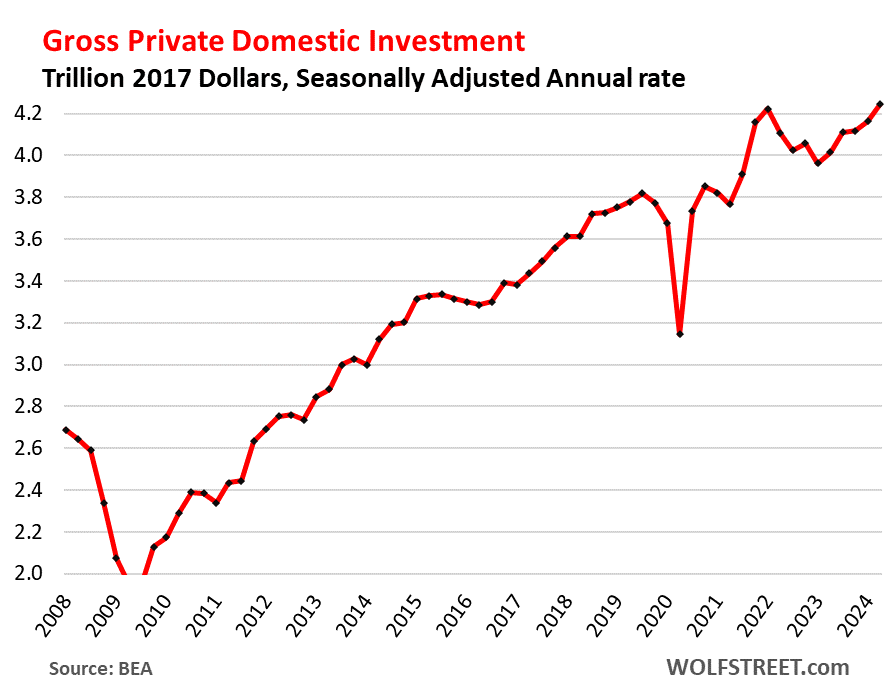
Gross private domestic investment jumped by 8.4%, to $4.25 trillion annualized and adjusted for inflation, a sharp acceleration from Q1 (+4.4%) and Q4 (+0.7%). Of which:
Fixed investment: +3.6%, of which:
- Residential fixed investment: -1.4% after the +16.0% spike in Q1
- Nonresidential fixed investments: +5.2%, the fastest growth in a year:
- Structures: -3.3%.
- Equipment: +11.6%
- Intellectual property products (software, movies, etc.): +4.5%.
Finally back to the peak in Q1 2022 of the free-money pandemic spike:
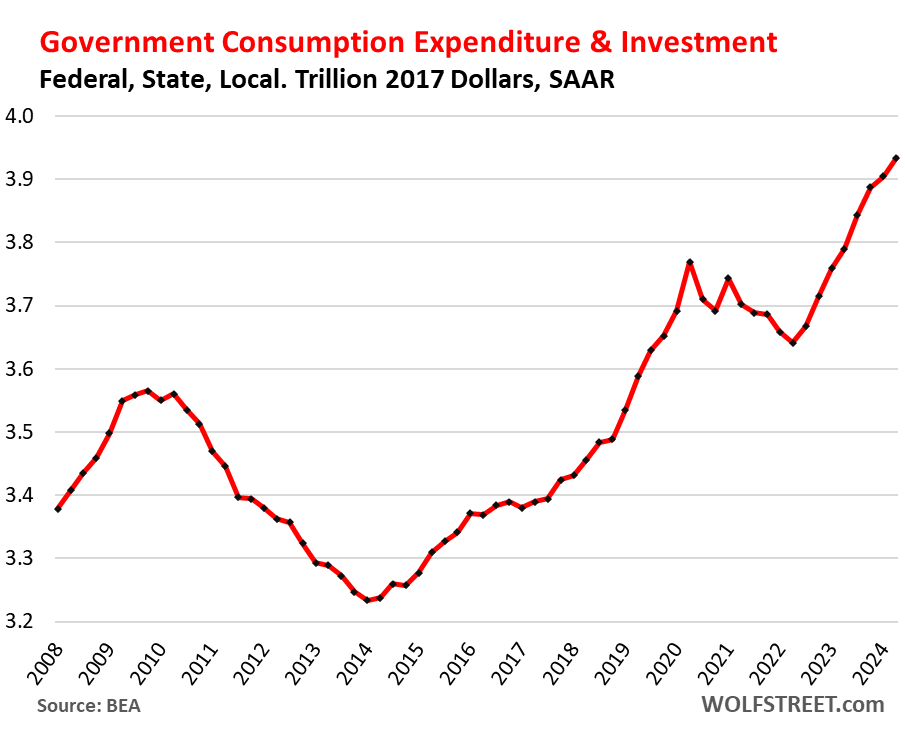
Government consumption expenditures and gross investment rose by 3.1%, to $3.9 trillion annualized and adjusted for inflation, up from the 1.8% growth rate in Q1.
Federal, state, and local government consumption and investment accounts for 17% of GDP (state and local governments account for 61% of government spending, the federal government for 39%).
This does not include transfer payments and other direct payments to consumers (stimulus payments, unemployment payments, Social Security payments, etc.), which are counted in GDP when consumers and businesses spend or invest these funds.
- State and local governments: +2.0%, to $2.42 trillion.
- Federal government: +3.9%, to $1.51 trillion, up from -0.2% in Q1.
- Defense +5.2% (to $846 billion)
- Nondefense +2.2% (to $668 billion).
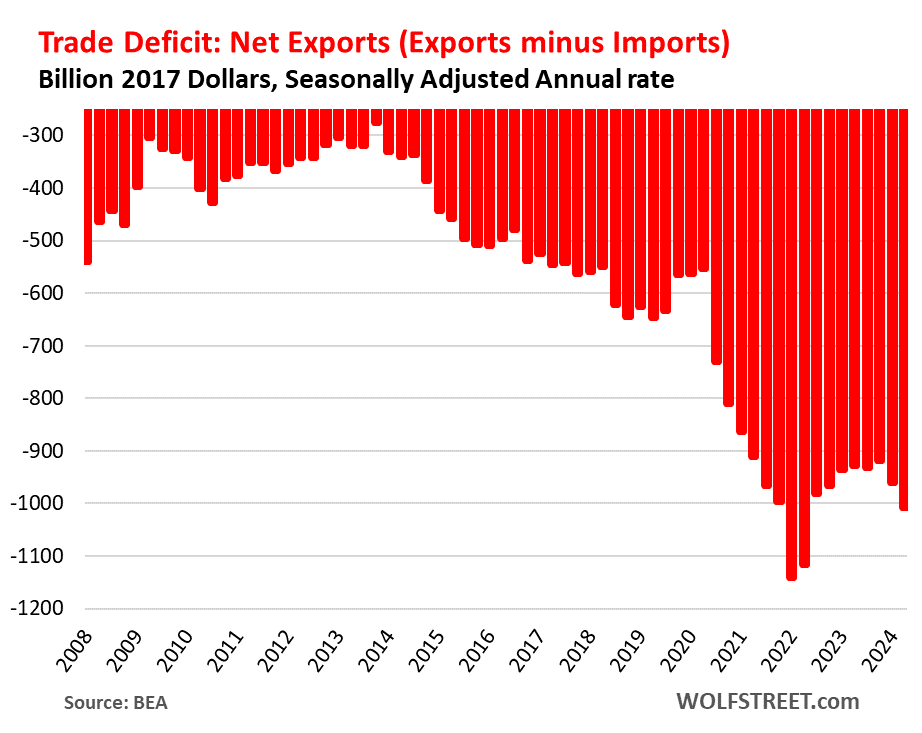
The Trade Deficit (“net exports”) in goods & services got more horrible:
- Exports: +2.0%, to $2.55 trillion
- Imports: +6.9%, to $3.56 trillion, of which goods +7.7% and services +3.6% (services imports includes spending by Americans traveling overseas).
- Net exports (exports minus imports): -4.7%, to -$1.01 trillion.
Exports add to GDP. Imports subtract from GDP. Exports are much smaller in dollars than imports, hence the trade deficit, or negative “net exports.”
The worsening imports dragged GDP growth (+2.8%) down by 0.93 percentage points. If imports had remained at the same horrible level as in Q1, rather than worsening further, GDP growth would have been 3.7%, instead of 2.8%.
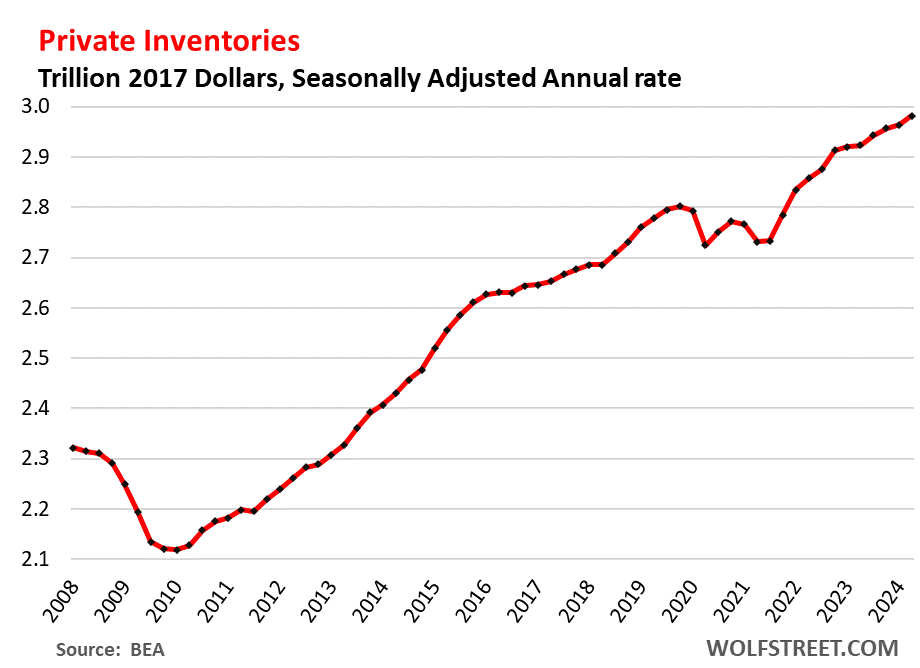
Change in private inventories: Inventories rose by 2.4% annualized in Q1 to $2.98 trillion. An increase in inventories counts in GDP as a business investment. In Q2, the faster rate of increase added 0.82 percentage points to GDP growth, after the slower rate of increase in Q1 had subtracted 0.42 percentage points from GDP growth.