Headline and core surprise on the downside: m/m 0.2% vs. 0.3% consensus, and 0.0% vs 0.1% consensus, respectively. More interestingly, Cleveland Fed core CPI nowcast for May m/m was 0.30%, actual was 0.16%.
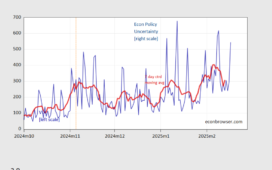
First, a comparison of different measures of headline – y/y, instantaneous, m/m:
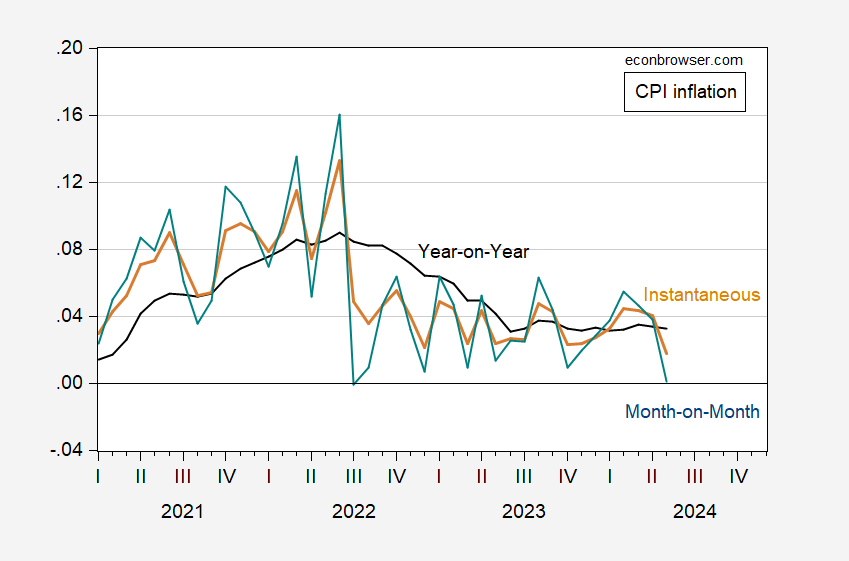
Figure 1: Year-on-Year CPI inflation (bold black), instantaneous inflation (T=12, a=4) per Eeckhout (2023) for CPI (tan), month-on-month (green), Source: BLS via FRED, and author’s calculations.
Instantaneous inflation declines to 1.8%, which is below the 2.45% CPI inflation consistent with a 2% PCE inflation.
What about core and supercore measures?
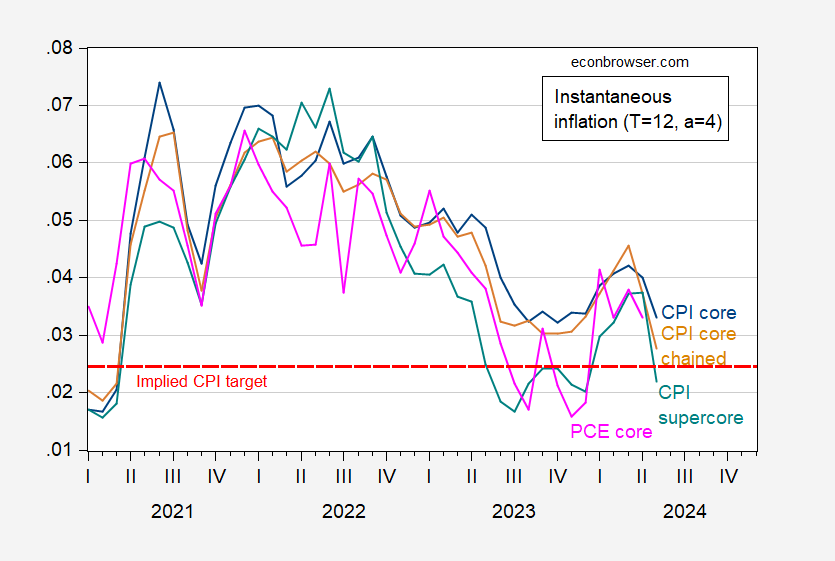
Figure 2: Instantaneous inflation (T=12, a=4) per Eeckhout (2023) for core CPI (blue), chained core CPI, seasonally adjusted by author using X-13 (tan), PCE deflator (pink), CPI supercore (teal). Implied CPI target incorporates the 0.45 ppts CPI-PCE differential over the 1986-2024 period. Source: BLS, BEA via FRED, BLS, and author’s calculations.
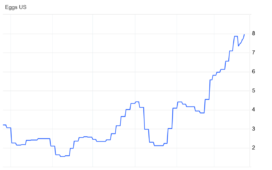
In addition to the positive information in the CPI measures, food prices continue to decline.
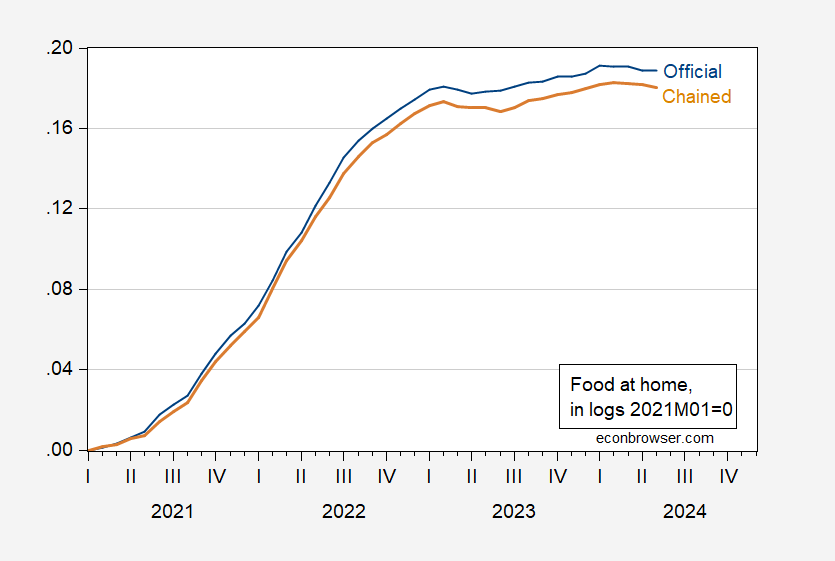
Figure 3: CPI component – food at home (blue), and Chained CPI component – food at home, seasonally adjusted by X-13 by author (tan), both in logs 2021M01=0. Source: BLS and author’s calculations.
In other words, while official year-on-year food at home inflation is 1.04%, instantaneous is -0.2% (q/q is -0.8% annualized), and chained (seasonally adjusted by author) is -0.7%.
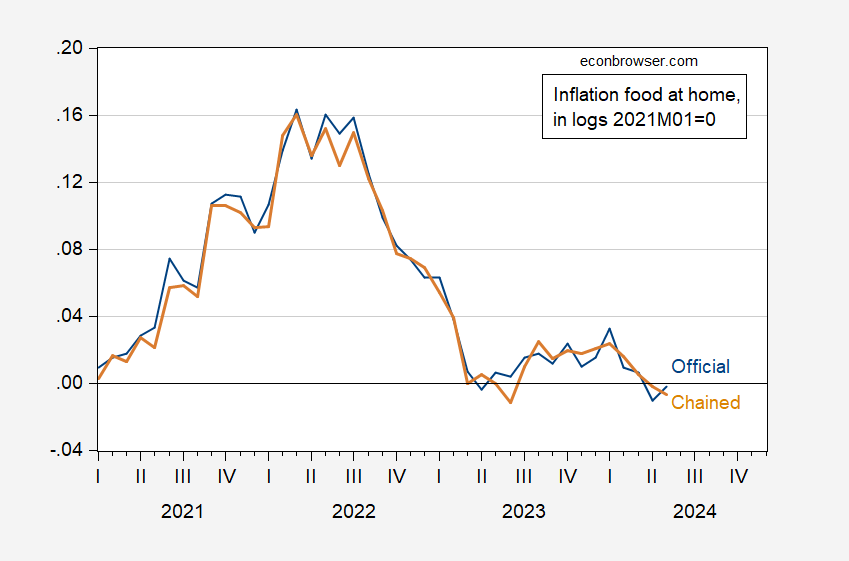
Figure 4: Instantaneous inflation rate (T=12, a=4) per Eeckhout (2023) for food at home (blue), and chained, seasonally adjusted by X-13 by author (tan). Source: BLS and author’s calculations.