Yves here. This article shows that the robustness, or lack thereof, of the elderly is starting to get official attention. The authors constructed a frailty index, using data from the Health and Retirement Study and the English Longitudinal Study of Ageing. which frustratingly the authors do not indicate precisely what the information consists of: is it all objective measures or does it include self-reporting? Has there been an attempt to validate any self-assessments?. Their description:
Frailty indices aggregate information across a range of indicators (e.g. medical conditions, ability to perform certain activities) and are scored from 0 (low) to 1 (high) to reflect a person’s physiological (both mental and physical) frailty.
The reason for taking interest is that efforts like these might affect policy, and well done, they could or should also affect medical practice. However, the way the medical part is becoming a pursuit of anti-aging, which often includes big ticket quackery, and questionable trickle-down to regular patients. Admittedly, as some readers pointed out yesterday in the active discussion of Nancy Pelosi’s hip fracture, many older people and even not so old people get marching orders as to what to do to improve their health, and even with personal attention, like regular visits from physical therapists, many refuse to comply.
This piece also unintentionally hints where these tendencies may be going. It cites the new hot weight loss drugs, the GLP-1 agonists like Ozempic, as lowering biological age. But is there any all-cause mortality data on long-term use? I don’t think there is yet that sort of data. And I do not know how often patients decide to stop using them, but they seem to gain the weight back when they do. I have read that some, perhaps even many, become voraciously hungry, so it could even be that some wind up worse off.
In terms of longevity and biological age effects, one would think that the fat and obese losing weight would be a clear health benefit: reduced load on the heart and joints, better blood sugar readings and so lowered risk of diabetes,.
But one of the side effects of GLP-1 agonist use is Ozempic butt and Ozempic face, which the results of internet searches depict as the result of fat loss. But that is not fully consistent with IM Doc’s findings. Via e-mail:
I am seeing large numbers of formerly obese patients who are now looking like Icabod Crane – massive facial muscle and arm and thigh muscle loss. Thanks to Ozempic et al.
Recall the frailty framing, that that is the defining aspect of biological versus calendar age.
Consistent with that I had a very very good endocrinologist back in the day. Eventually as many did he converted his entire practice to monthly (high) fee anti-aging.
He went to a lot of anti-aging conferences.
At one, the doctors were given a list of 20 metrics, like VO2 max, a1c, resting pulse, LDL, blood pressure, testosterone, triglycerides, BMI, bone density, kidney function measures and so on.
They were asked to guess the one that best predicted biological age as opposed to physical age.
The two best in reality:
1. Strength
2. Muscle mass
So if GLP-1 agonists are having the effect of reducing muscle, are they necessarily as beneficial as depicted? Admittedly, when body builders are dieting down to minimize their body fat for contests, they do lose muscle mass too. But they do not lose strength. This issue bears watching.
And will other new wonder drugs be scrutinized for their impact on biological age as well as all factor mortality?
By Rainer Kotschy, Visiting Scientist Harvard T.H. Chan School of Public Health; Postdoctoral Fellow National Bureau Of Economic Research (NBER); David Bloom, Clarence James Gamble Professor of Economics and Demography Harvard University; and Andrew Scott Director of Economics Ellison Institute of Technology; Professor of Economics London Business School. Originally published at VoxEU
Analysis of population ageing is typically framed in terms of the number of years lived since birth. This column uses data from studies on physiological functioning in the US and English populations aged 50 and older to show that for policy and research purposes, the reliance on chronological age is at best incomplete and at worst misleading as it provides only limited information about the ageing process. Improvements in how we measure ageing and our understanding of how it affects people and the economy are needed if we are to adapt to the reality of longer lives and overcome the challenges posed by population ageing.
Populations worldwide are growing older. Falling birth rates, increases in life expectancy, and the progression of large-sized cohorts to advanced ages are leading to both rising proportions and numbers of older people. For instance, in Japan, one of the countries furthest along the demographic transition, the proportion of the population aged 65 and older rose from 4.9% in 1950 to 29.6% in 2020 and is projected to reach 37.5% in 2050 (United Nations 2024).
Population ageing is seen as a major economic challenge, adversely impacting the growth of GDP and the sustainability of public finances (Smith et al. 2015, Bloom 2019, Goodhart and Pradhan 2021, Kotschy and Bloom 2023a, Cooley et al. 2024).
Analysis of population ageing is typically framed in terms of chronological age – i.e. the number of years lived since birth. This framing has multiple advantages: chronological age is readily understood, easily measured, widely available, and commonly defined across both individuals and over time. These features, along with rising numeracy and literacy, led to the introduction of chronological age in regulations and bureaucratic measures (e.g. compulsory schooling ages, restrictions on child labour, and the right to marry) in the UK and the US in the 18th and 19th centuries (Thomas 1976, Chudacoff 1989).
The widespread use of chronological age in the context of population ageing came with the introduction of modern pension systems. In 1889, Germany launched the world’s first modern pension system with a retirement age of 70, later lowered to 65 (Mierzejewski 2016). The use of chronological age to define the ‘old’ was a natural extension of this bureaucratic standardisation. The legacy of this approach is evident in how we measure the existence and extent of population ageing today.
In recent work (Kotschy et al. 2024), we show that for policy and research purposes, the reliance on chronological age is at best incomplete and at worst misleading. That is because chronological age – the mostly widely used indicator of ageing – provides only limited information about the ageing process.
The underlying problem is that chronological age is not revealing about how we age. Instead, its use is justified as a proxy for a variety of underlying measures capturing different dimensions of ageing such as biological resilience, cardiovascular fitness, cognitive functioning, and wisdom. Chronological age can be a useful shorthand for these multiple dimensions, but it does not directly measure or illuminate the key mechanisms and characteristics of the ageing process.
Ageing plays a central role in multiple economic processes, behaviours, and outcomes. Examples are life cycle issues involving consumption, savings, labour supply, and education, as well as preferences and macroeconomic issues of productivity, innovation, and growth. However, as we show, chronological age per se is rarely the relevant variable of interest. For instance, in issues of labour supply it is often health and declines in physical and cognitive capacities that matter (Blundell et al. 2016). Similarly, when it comes to saving, what matters is how much remaining time a person can expect to live (what Sanderson and Scherbov 2019 call ‘prospective age’) and not how long they have already lived (Strulik 2023).
The usefulness of chronological age for policy and research depends on it having a stable and well-defined relationship with key dimensions of ageing, such as physiological functioning. But if the aim is to provide insights as to how to adapt to increased longevity (Scott 2024), chronological age will be an unstable and imperfect proxy for the key dimensions of ageing. For instance, Kotschy and Bloom (2023b) show how shifts in physiological ageing, as measured by changes in population age structure and longevity, can lead to more optimistic projections of GDP growth under population ageing due to expansions of labour potential into the older ages.
To explore the extent to which chronological age reliably approximates population ageing, we used data from the Health and Retirement Study and the English Longitudinal Study of Ageing and constructed frailty indices (Mitniski et al. 2001) to measure physiological functioning in the US and English populations aged 50 and older. Frailty indices aggregate information across a range of indicators (e.g. medical conditions, ability to perform certain activities) and are scored from 0 (low) to 1 (high) to reflect a person’s physiological (both mental and physical) frailty. As summary measures of ageing, they are increasingly popular in economics literature (e.g. Abeliansky and Strulik 2018, Hosseini et al. 2022, Old and Scott 2023).
Our analysis spotlights three reasons why chronological age cannot be expected to reliably approximate physiological age: heterogeneity, malleability, and multidimensionality of physiological functioning.
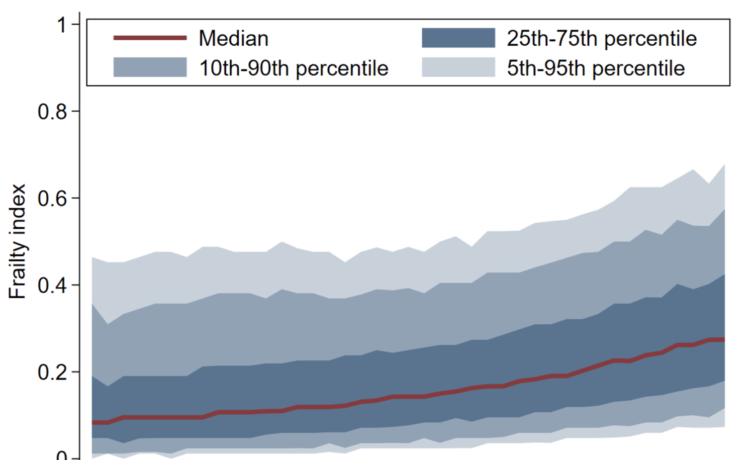
With respect to heterogeneity, people of the same age differ appreciably in physiological functioning, and increasingly so. Figure 1 shows that frailty tends to rise with chronological age; however, there is enormous variation across people. The healthiest 10% of the population at age 90 are close to the level of frailty displayed by the median 50-year-old, and the healthiest 25% of 90-year-olds are in better health than the least healthy 50-year-olds. In fact, chronological age accounts for less than 10 percent of the variation in frailty in bivariate regressions (Kotschy et al. 2024, Table 1). This within-group variation means that chronological age alone is a rather unreliable indicator of a person’s physiological functioning.
Figure 1 Frailty distribution in the US by chronological age
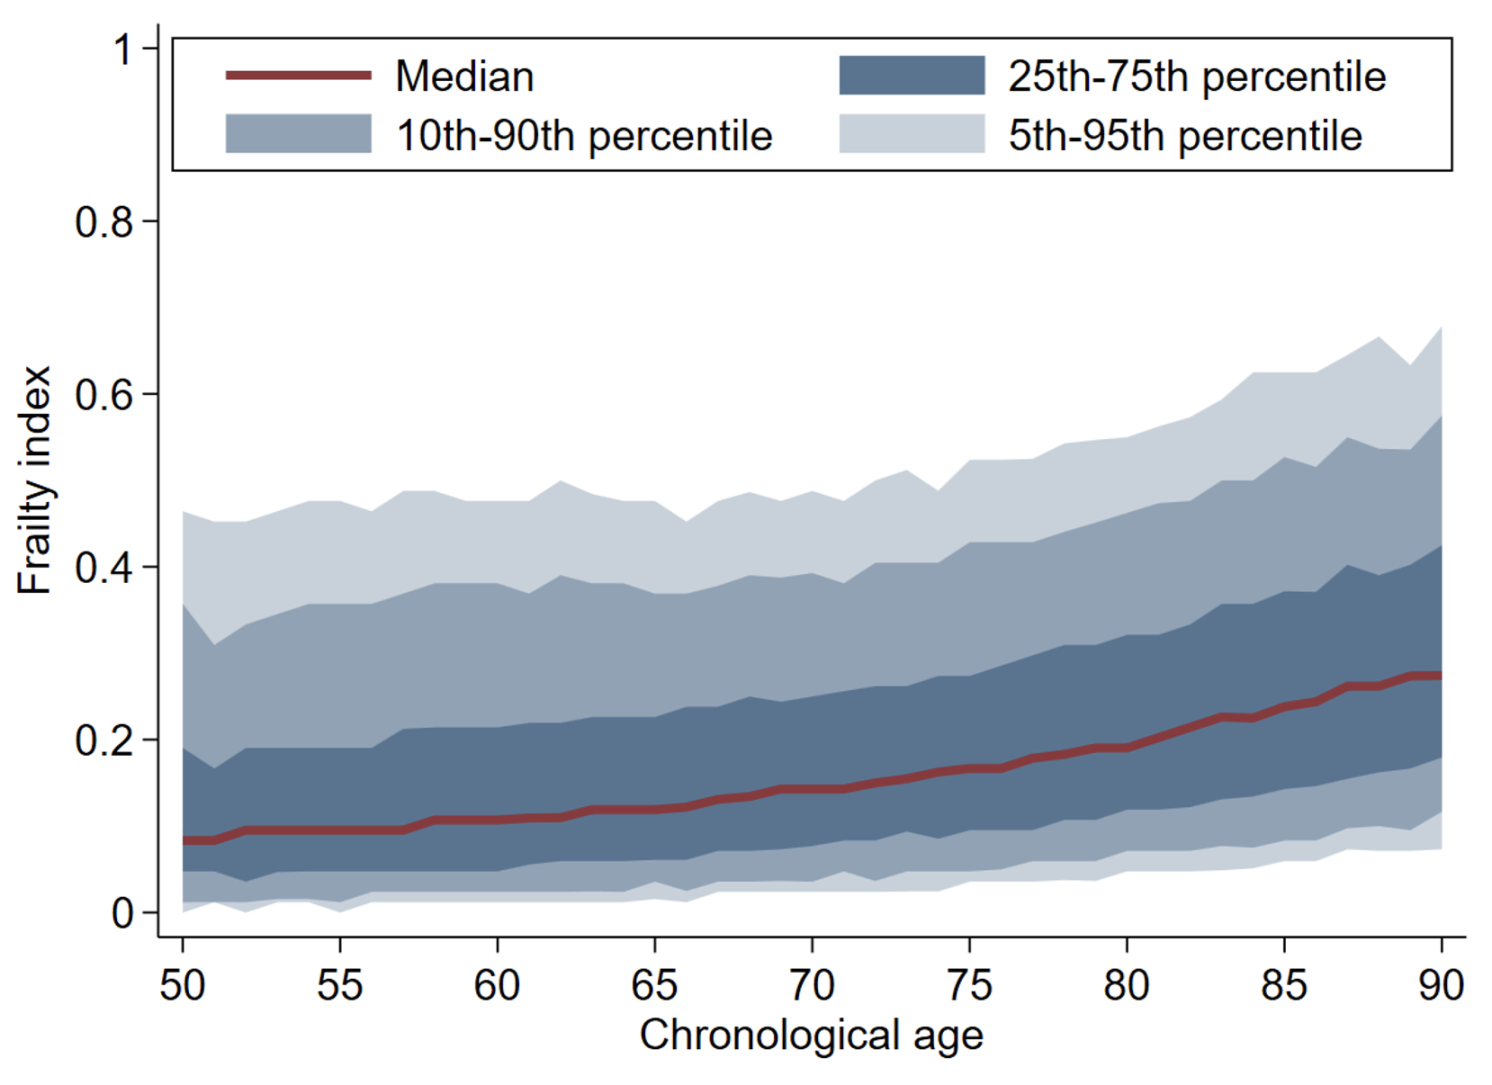
Note: Authors’ calculations (see Kotschy et al. 2024, description of Figure 1a). This figure shows patterns and trends in physiological functioning, as measured by the frailty index, in the US conditional on chronological ages for different percentiles.
Malleability refers to the fact that the rate at which people physiologically age can change over time. This phenomenon, reflected in popular phrases such as “70 is the new 60”, might become even more pronounced if new therapeutics emerge exploiting advances in the biology of ageing (Campisi et al. 2019); noteworthy examples are GLP-1 agonists and new vaccines. It could also result from improved living standards and related changes in consumption toward healthier diet and increases in physical activity.
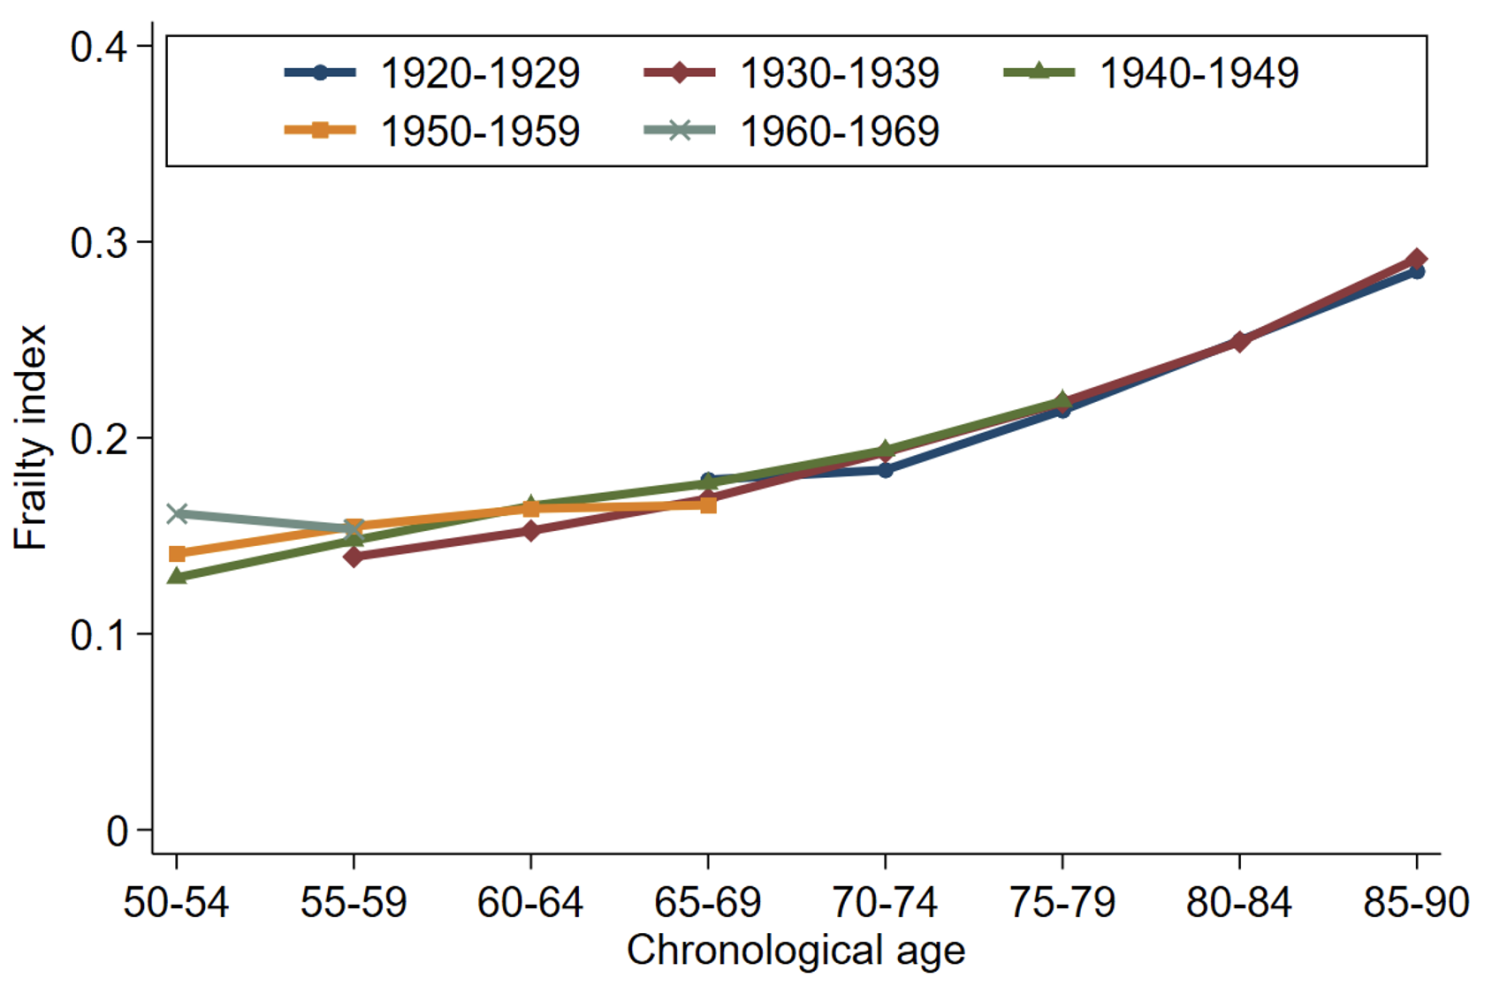
Figure 2 shows frailty indices for different birth cohorts in the US (Panel a) and England (Panel b). Conditional on chronological age, average frailty levels have decreased in England but not in the US. This observed malleability implies that population measures of chronological age will not adequately reflect the degree of population ageing over time and across countries.
Figure 2 Average frailty by chronological age and birth cohort in the US and England
a) Average frailty by age and cohort: US
a) Average frailty by age and cohort: England
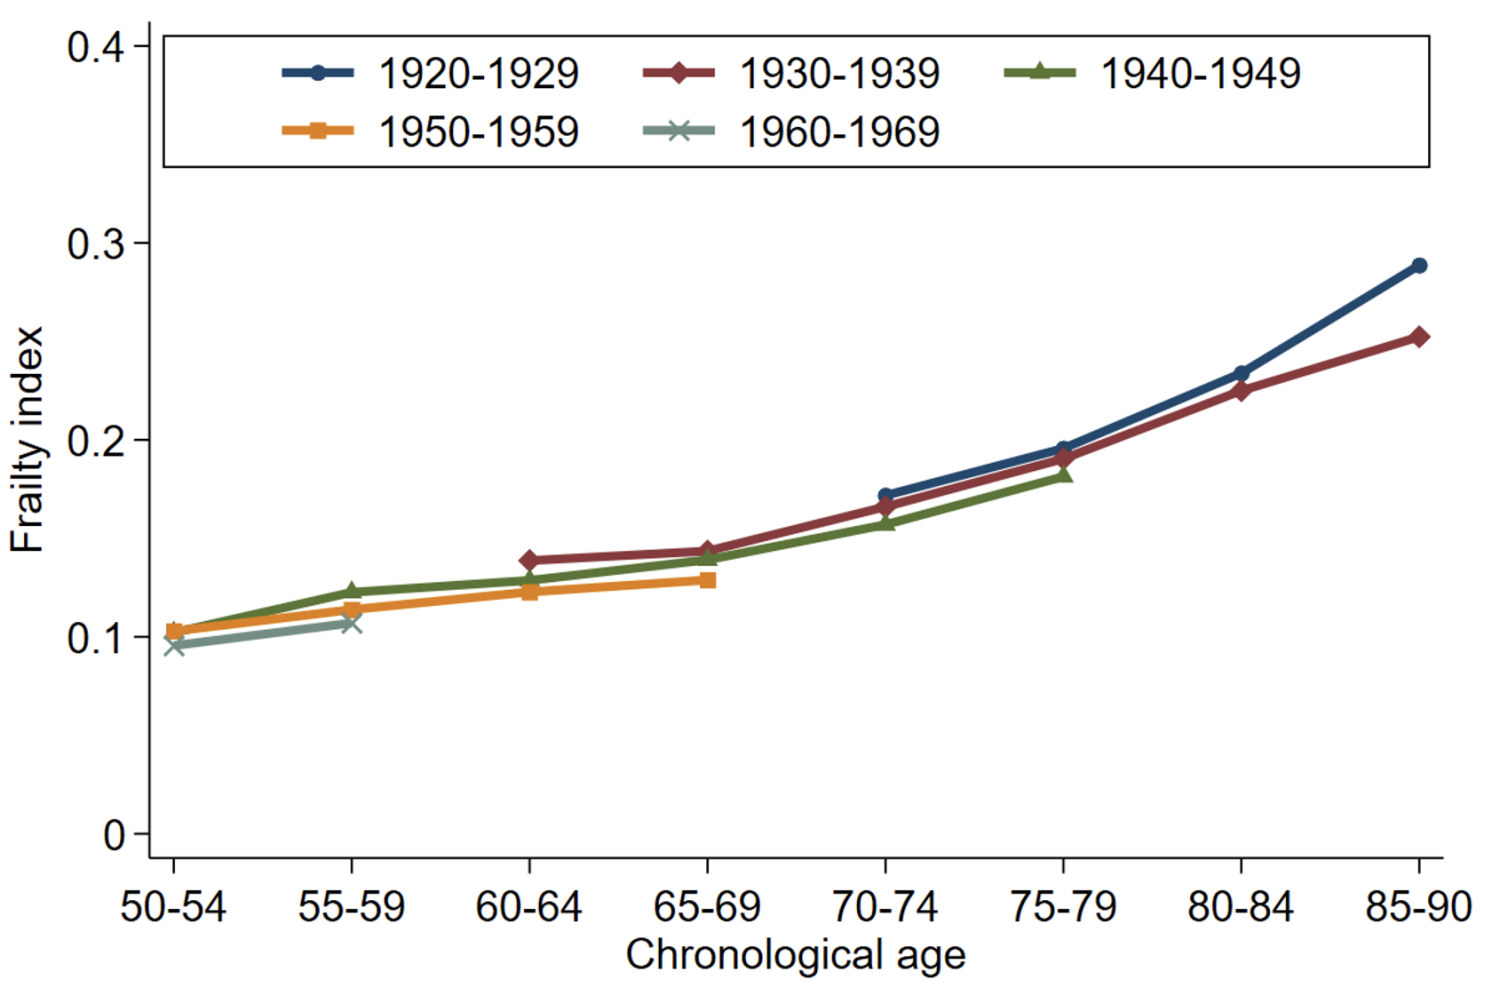
Note: Authors’ calculations (see Kotschy et al. 2024, description of Figures 1c and 1d). This figure shows patterns and trends in physiological functioning, as measured by the frailty index, in the US and England conditional on chronological ages across five birth decades, covering the 1920s to the 1960s.
The multidimensionality of ageing represents another reason that chronological age might not accurately approximate physiological functioning. If different domains of physiological functioning – such as locomotor, cognitive, and sensory functioning – show different trends, the reliance on median age or the proportion of the population aged 65 and older will likely conceal differences in the trends and patterns of the underlying domains of physiological functioning.
Figure 3 shows that the mobility components of the frailty index have a steeper age gradient than the psycho-cognitive components. Moreover, average frailty levels have somewhat decreased across birth cohorts in the psycho-cognitive domain but not in the mobility domain. The implications of population ageing therefore differ substantially depending upon which dimension of ageing is important, something that chronological age will not naturally capture.
Figure 3 Age patterns in physiological functioning across different domains in the US
a) Mobility components
b) Psycho-cognitive components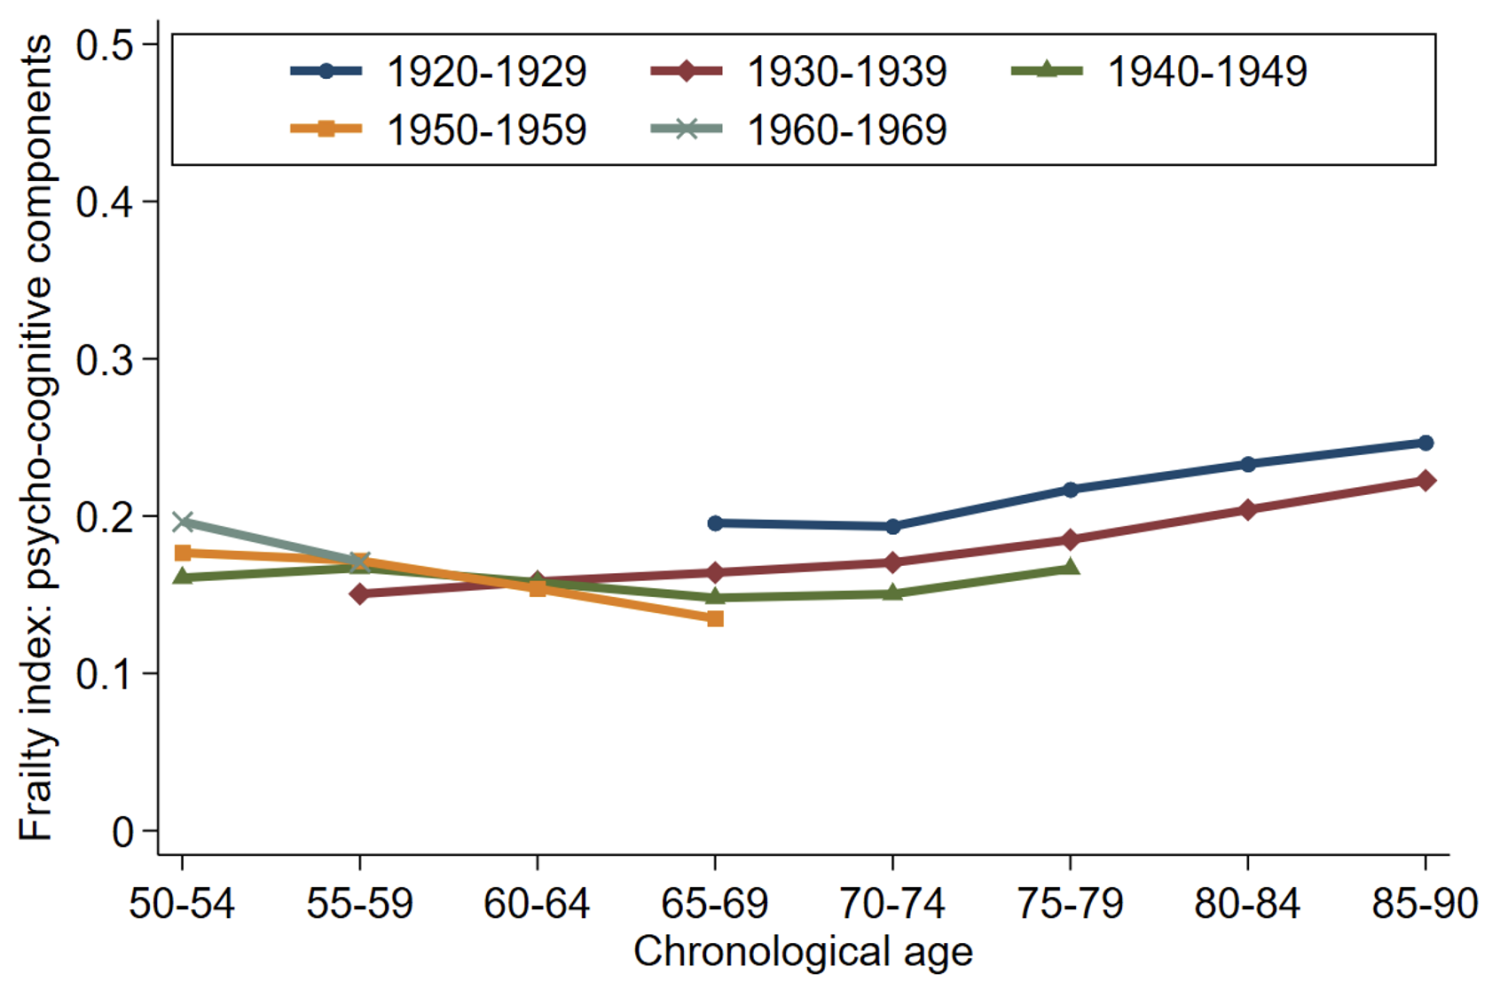
Note: Authors’ calculations (see Kotschy et al. 2024, description of Figure 2). This figure shows age patterns in physiological functioning, as measured by a frailty index, in the mobility domain (Panel a) and the psycho-cognitive domain (Panel b) across five birth decades, covering the 1920s to the 1960s.
These three problems – heterogeneity, malleability, and multidimensionality – all point to difficulties in using chronological age as a measure for ageing.
Our empirical analyses underscore the real-world nature and importance of these difficulties. We analysed data from the US Health and Retirement Study to compare the predictive power of chronological age and physiological functioning for key economic behaviours and outcomes (including employment, working hours, hourly wages, volunteering, help to others, life satisfaction, out-of-pocket medical spending, and recent overnight stays in a nursing home or hospital).
Our results document that (1) all variables, except for hourly wages, are influenced by physiological functioning (as measured by a frailty index); (2) for most outcomes chronological age and physiological functioning have independent effects; and (3) the inclusion of a frailty index barely affects the estimated effects associated with chronological age (Kotschy et al. 2024, Table 2). The upshot of this analysis is that chronological age does not reliably account for the effects of physiological functioning on economic behaviour and outcomes. In fact, the effects chronological age picks up are distinctly different from the effects picked up physiological functioning.
Overcoming the challenges posed by population ageing requires a precise understanding of how we age, the economic consequences associated with ageing, and how to achieve better health and economic outcomes. Chronological age has the virtues of simplicity and regularity. However, the heterogeneity, malleability, and multidimensionality of physiological functioning among people at the same chronological age limits the usefulness of chronological age in research and policy settings.
Further work is much needed to improve the measurement of ageing and our understanding of how it affects people and the economy if we are to adapt and adjust to the reality of longer lives and overcome the challenges posed by population ageing.
See original post for references

