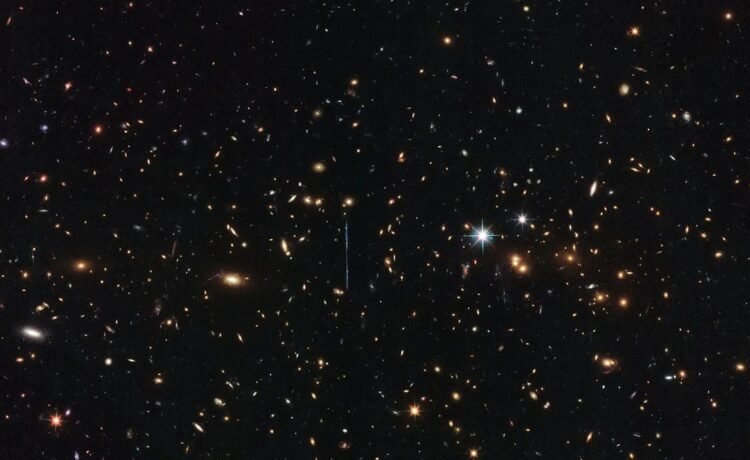
This large-field, 2014-era composite Hubble image of the colliding galaxy cluster, El Gordo, showcases the most massive galaxy cluster ever discovered from the first half of our cosmic history. Known officially as ACT-CLJ0102–4915, it is the largest, hottest, and X-ray brightest galaxy cluster ever discovered in the distant Universe, containing many thousands of times the mass of the Local Group. It is all gravitationally bound together, but the galaxies located outside of it are not bound to it, and will expand away from this cluster as the Universe continues to expand. (Credit: ESA/Hubble & NASA, RELICS)
The planet, the Solar System, and the galaxy aren’t expanding. But the whole Universe is. So where does the dividing line begin?
For nearly 100 years, we’ve known our Universe is expanding.
Press enter or click to view image in full size
Possible fates of the expanding Universe. Notice the differences between models in the past; only a Universe with dark energy matches our observations, and the dark energy-dominated solution came from de Sitter all the way back in 1917. By observing the expansion rate today and measuring the components present in the Universe, we can determine both its future and past histories. (Credit: NASA & ESA)
A photo of Ethan Siegel at the American Astronomical Society’s hyperwall in 2017, along with the first Friedmann equation at right. The first Friedmann equation, an exact solution in general relativity, details the Hubble expansion rate squared on the left hand side, which governs the evolution of spacetime. The right side includes all the different forms of matter and energy, along with spatial curvature (in the final term), which determines how the Universe evolves in the future. This has been called the most important equation in all of cosmology and was derived by Friedmann in essentially its modern form back in 1922. (Credit: Harley Thronson (photograph) and Perimeter Institute (composition))
Observations of galactic distances and redshifts validate an expanding Universe.
Press enter or click to view image in full size
This graph shows the 1550 supernovae that are a part of the Pantheon+ analysis, plotted as a function of magnitude versus redshift. The supernova data, for many decades now (ever since 1998), has pointed toward a Universe that expands in a particular fashion that requires something beyond matter, radiation, and/or spatial curvature: a new form of energy that drives the expansion, known as dark energy. The supernovae all fall along the line that our standard cosmological model predicts, with even the highest-redshift, most far-flung type Ia supernovae adhering to this simple relation. Calibrating the relation without substantial error is of paramount importance. (Credit: D. Brout et al./Pantheon+, Astrophysical Journal, 2022)
The evidence supporting our cosmic expansion has been overwhelming since the 1920s.
Press enter or click to view image in full size
Edwin Hubble’s original plot of galaxy distances, from 1929, versus redshift (left), establishing the expanding Universe, versus a more modern counterpart from approximately 70 years later (right). Many different classes of objects and measurements are used to determine the relationship between distance to an object and its apparent speed of recession that we infer from its light’s relative redshift with respect to us. As you can see, from the very nearby Universe (lower left) to distant locations over a billion light-years away (upper right), this very consistent redshift-distance relation continues to hold. Earlier versions of Hubble’s graph were composed by Georges Lemaître (1927) and Howard Robertson (1928), using Hubble’s preliminary data. (Credit: E. Hubble; R. Kirshner, PNAS, 2004)