Reader Michael writes:
…high income wage growth has grown much faster than medium and low income wage growth patterns.
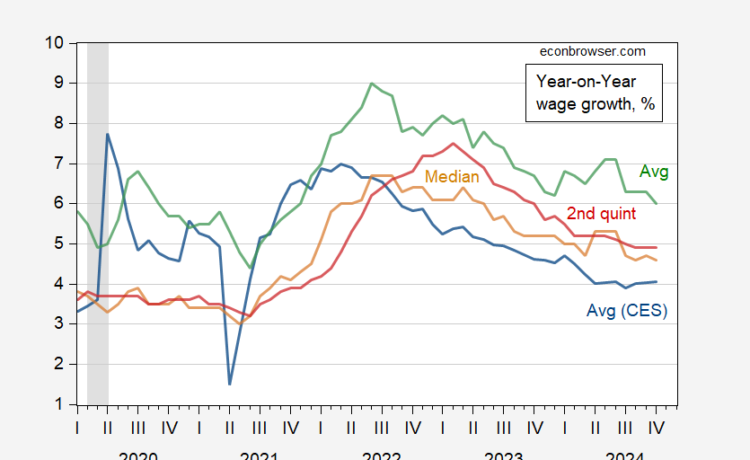
Here’s a stab at taking a look at the data. First wages:
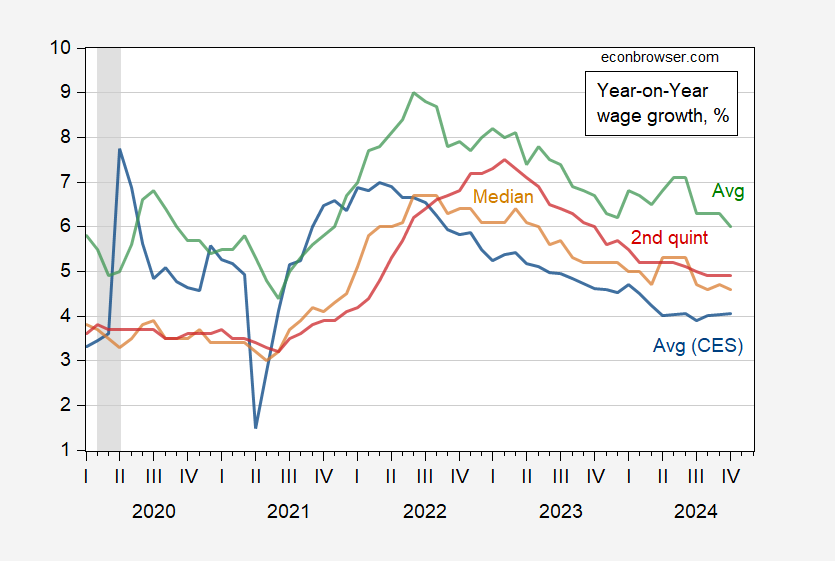
Figure 1: Year-on-Year growth rate in average hourly earnings from CES (blue), average wage from CPS (green), median wage from CPS (tan), from 2nd quintile (red), all in %. NBER defined peak-to-trough recession dates shaded gray. Source: BLS, Philadelphia Fed Wage Tracker, NBER, and author’s calculations.
What about relative to inflation? Here, one would try to match up with the most appropriate deflators. Here’s my attempt.
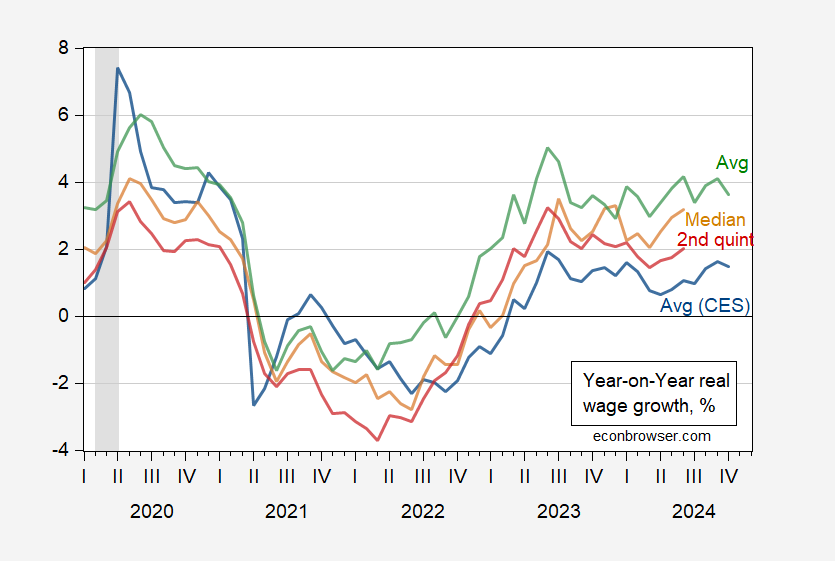
Figure 2: Year-on-Year growth rate in average hourly earnings from CES, deflated by CPI-U (blue), average wage from CPS, deflated by CPI-wage earners (green), median wage from CPS, deflated by median household income CPI (tan), from 2nd quintile deflated by 2nd quintile household income CPI (red), all in %. NBER defined peak-to-trough recession dates shaded gray. Source: BLS, Philadelphia Fed Wage Tracker, BLS, NBER, and author’s calculations.
So year-on-year real wage growth has been positive from between 2022M10 to 2023M02 onward.

