From the Fed today:
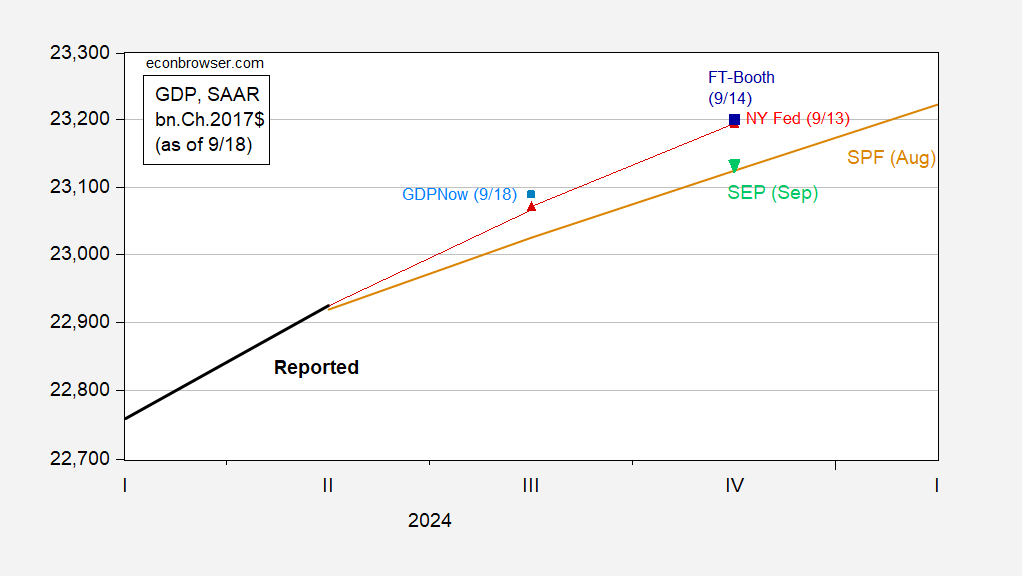
Figure 1: GDP (bold black), Summary of Economic Projections median (inverted light green triangle), GDPNow as of 9/18 (light blue square), NY Fed nowcast as of 9/13 (red triangle), FT-Booth as of 9/14 (blue square), and August median SPF (tan), all in bn.Ch.2017$ SAAR. Levels calculated by iterating growth rate on levels of GDP, except for Survey of Professional Forecasters. Source: BEA 2024Q2 2nd release, Atlanta Fed, NY Fed, Philadelphia Fed, Federal Reserve September 2024 SEP and author’s calculations.
Goldman Sachs tracking at 3% q/q AR (vs. 2.9% for GDPNow). Note that the median q4/q4 growth rate from the SEP (2.0%) was essentially the same as in the June SEP (2.1%). September SEP low/high range is 1.8%-2.6%, with central tendency ranging from 1.9% to 2.1%.