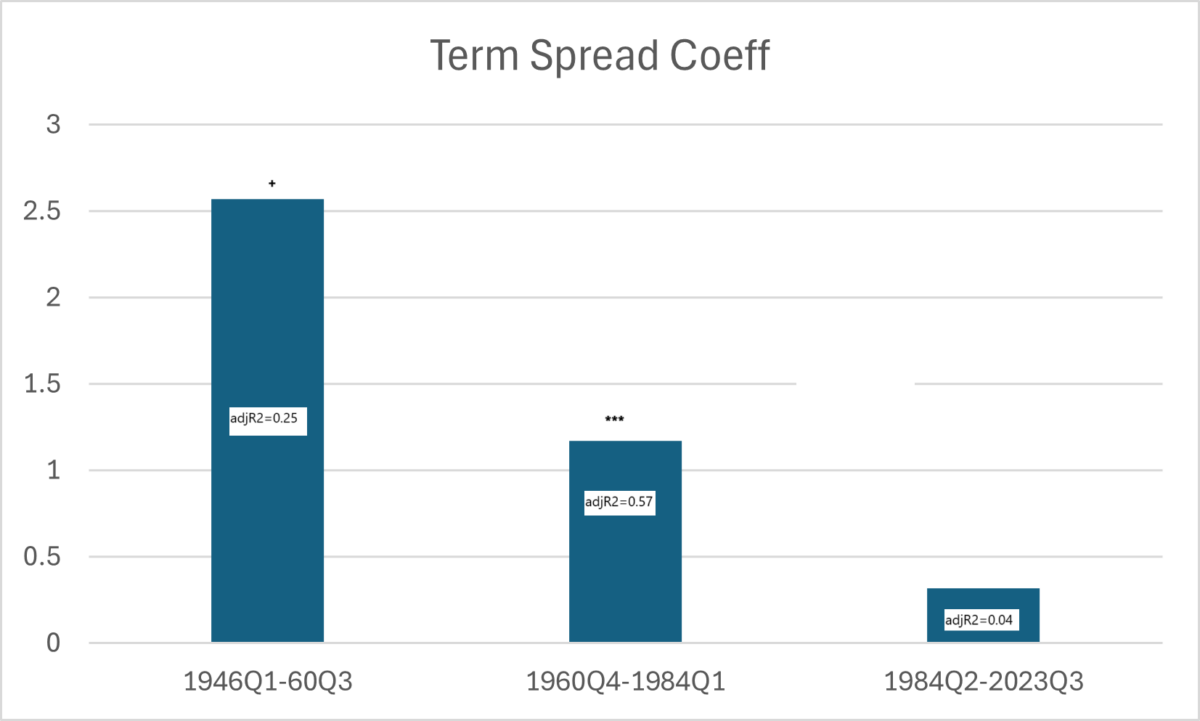
Following up on the examination of what the term spread predicts, here’s the slope coefficients for the term spread, in regressions augmented with short rate, from 1946-2023Q3 (GDP growth 1947-2024Q3).
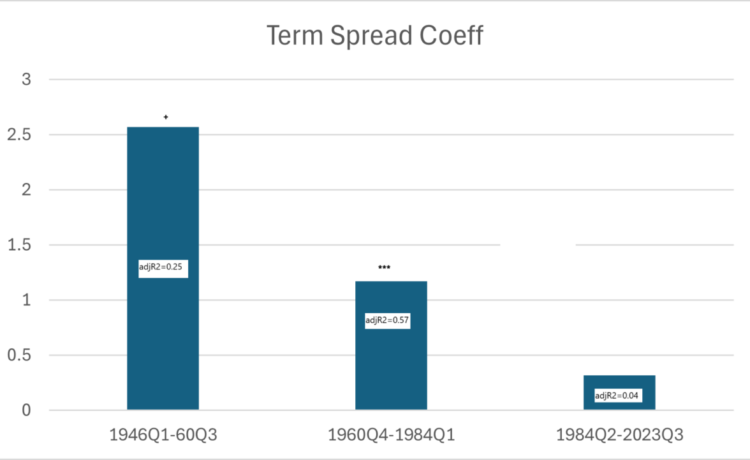
Figure 1: Regression coefficient of GDP growth lead 4 quarters on 10yr-3mo spread for subsamples. + (***) indicates significance at 11% (1%) msl, using Newey-West standard errors. Source: Author’s calculations.
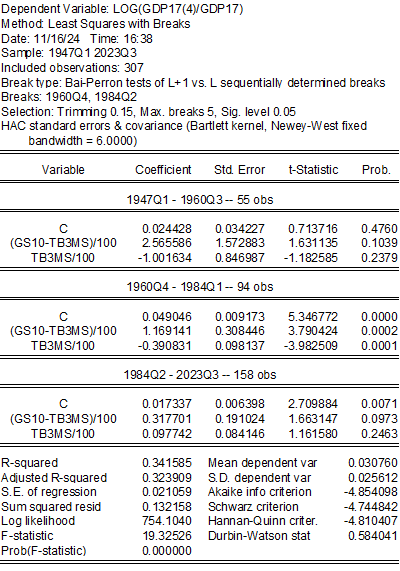
The overall least-squares break regression result (Bai-Perron) is:
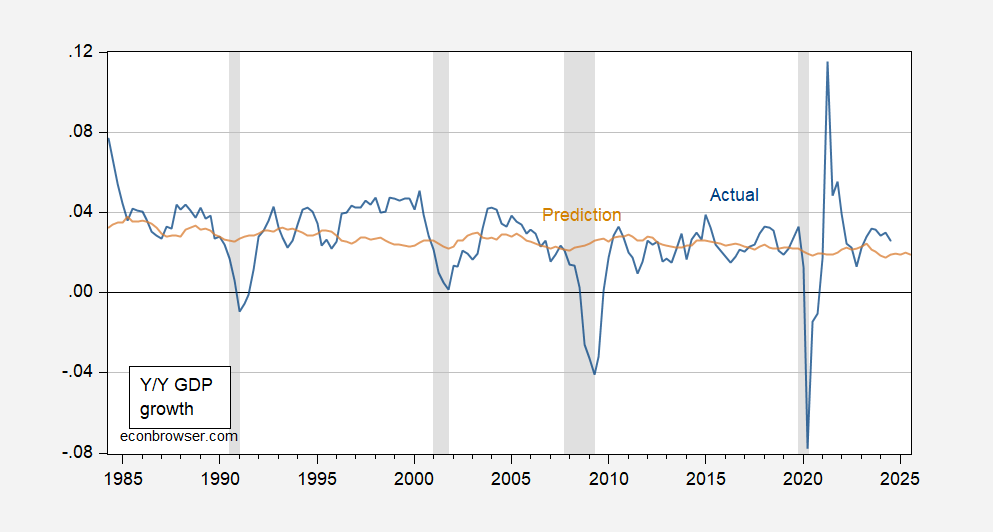
If one runs a simple OLS regression on the last subsample (1984Q2-2023Q3), the adjusted-R2 is only 0.04. The prediction looks like the following:
Figure 2: Year-on-Year GDP growth rate (blue) and predicted (tan). NBER defined peak-to-trough recession dates shaded gray.
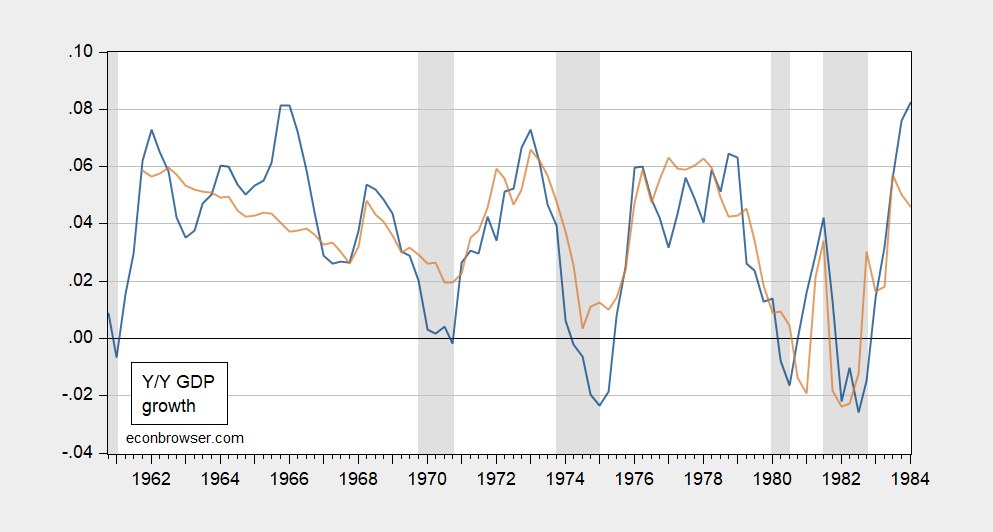
Clearly, the term spread Compare with the middle period identified by the Bai-Perron method:
Figure 3: Year-on-Year GDP growth rate (blue) and predicted (tan). NBER defined peak-to-trough recession dates shaded gray.
These results suggest that the term spread is not currently a great predictor of growth (although it may become so again in the future).

