Heritage Foundation EJ Antoni channels ShadowStats:
“Government economic figures hide the truth about the economy…” Thang [sic] you,
@mises , for highlighting a recent paper @profstonge and I wrote that explains how inflation has been greatly underestimated – read the article by @RonPaul here:
https://t.co/cVroe5QwCT
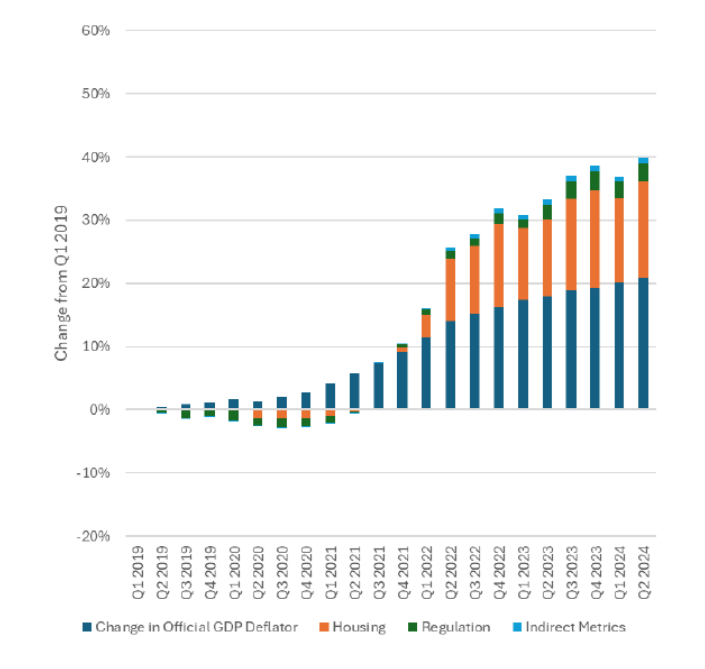
I have written a paper on the Antoni-St. Onge thesis that using the “right” deflators means GDP in 2024Q2 is below 2019Q2 levels, but here I want to highlight one fact – what their alternative GDP deflator entails.
Source: Antoni and St. Onge (2024).
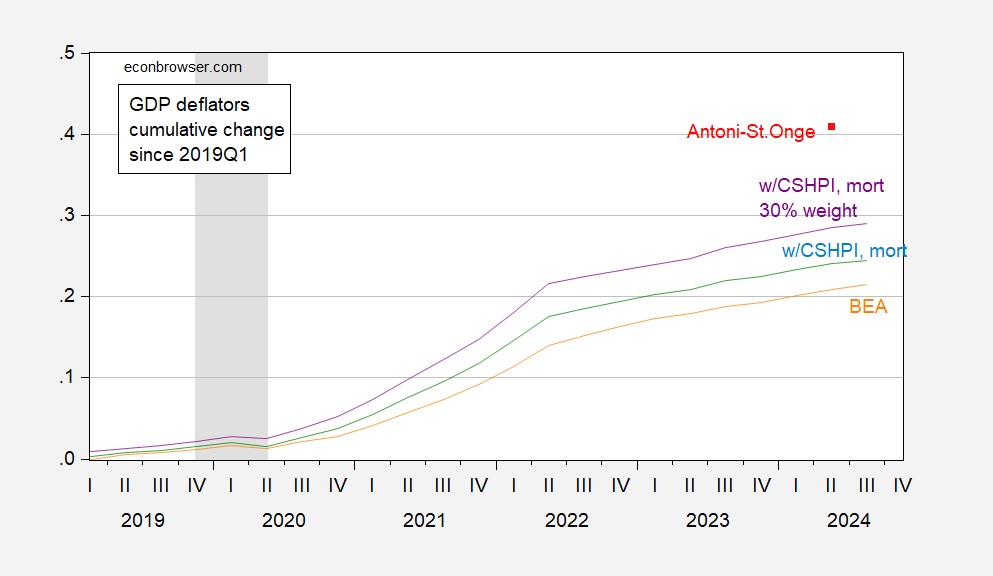
Notice the big orange area in the above graph, which Antoni and St. Onge attribute to their improved treatment of housing costs. I try to follow their argument, using the product of house prices (Case Shiller national house price index) and 30 year mortgage rates in place of the BEA’s component. I adjust real consumption accordingly (the authors do not mention adjustment to investment or government spending), and recalculate GDP (as shown in the paper). Updating the calculations with the most recent house price and NIPA data, I obtain the following picture of the implied deflators.
Figure 1: GDP deflator from BEA (orange), implied deflator replacing BEA housing costs with product of house prices and mortgage rate, at 15% weight in consumption (light blue), and at 30% weight (purple), and Antoni-St.Onge implied GDP deflator (red square), all relative to 2019Q1. NBER defined peak-to-trough recession dates shaded gray. Source: BEA, NBER, author’s calculations.
In other words, I cannot figure out how Antoni and St. Onge calculated their alternative GDP, nor their alternative deflator.

