Me, interviewed with Buzz Kemper, on BadgerTalks, recorded on 8/6 (Episode 44).
Some of the numbers I was thinking about:
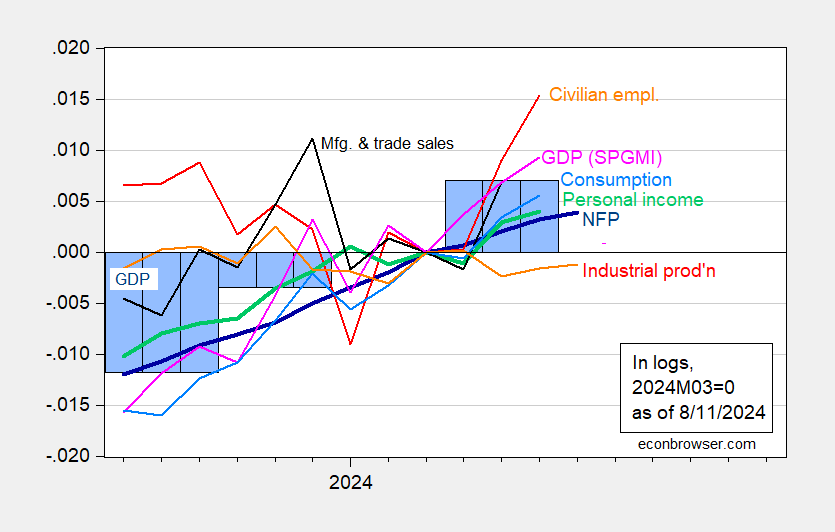
NBER indicators normalized to 2024M03:
Figure 1: Nonfarm Payroll (NFP) employment from CES (bold blue), civilian employment (orange), industrial production (red), personal income excluding current transfers in Ch.2017$ (bold green), manufacturing and trade sales in Ch.2017$ (black), consumption in Ch.2017$ (light blue), and monthly GDP in Ch.2017$ (pink), GDP (blue bars), all log normalized to 2023M04=0. Source: BLS via FRED, Federal Reserve, BEA 2024Q2 advance release, S&P Global Market Insights (nee Macroeconomic Advisers, IHS Markit) (8/1/2024 release), and author’s calculations.
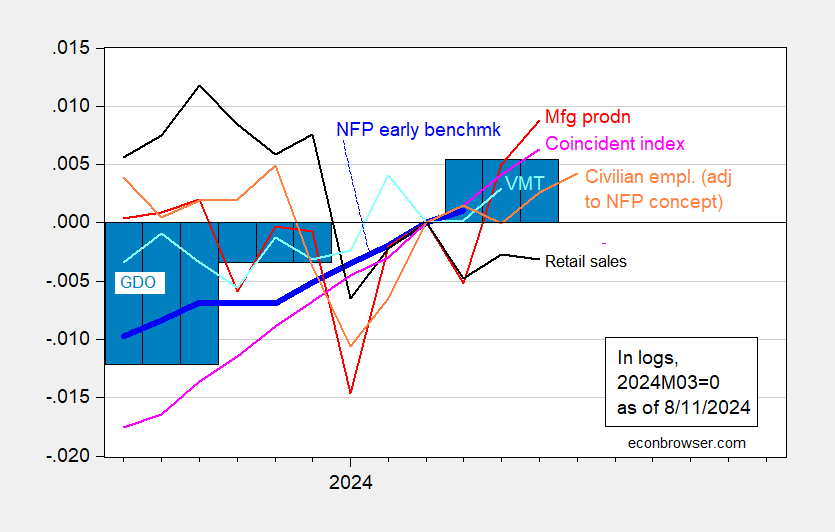
And alternative indicators normalized to the same date:
Figure 2: Nonfarm Payroll (NFP) employment Philadelphia Fed early benchmark (bold blue), civilian employment adjusted to NFP concept (orange), manufacturing production (red), retail sales (black), vehicle miles traveled (light blue), and Coincident Index (light pink), GDO (blue bars), all log normalized to 2023M04=0. GDI used in calculating GDO for 2024Q2 estimated by predicting 2024Q2 net operating surplus using GDP, lagged surplus, lagged differenced surplus, 2021Q1-2024Q1.Source: BLS via FRED, Federal Reserve, BEA 2024Q2 advance release, Philadelphia Fed, and author’s calculations.
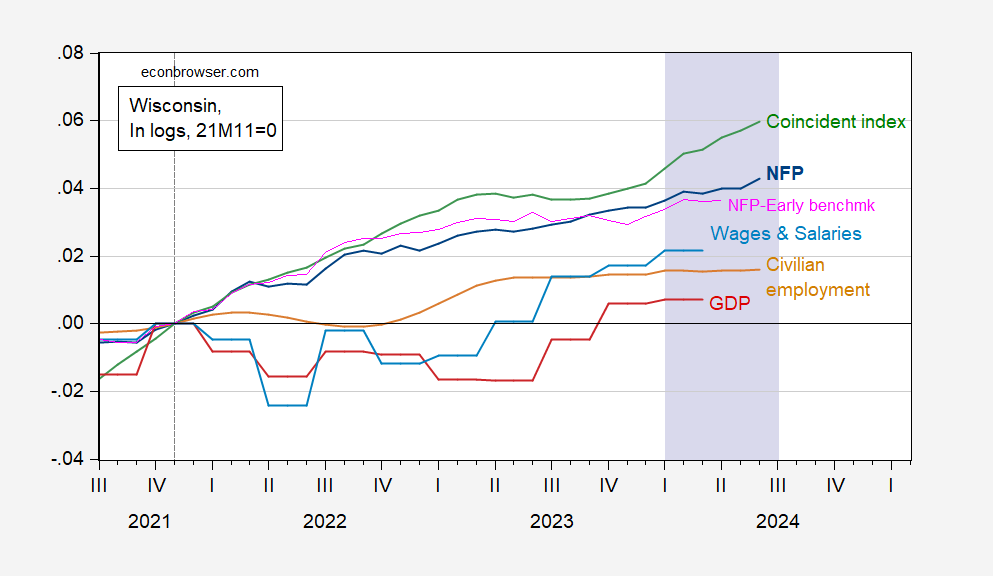
And for the Wisconsin economy:
Figure 3: Wisconsin Nonfarm Payroll Employment (dark blue), Philadelphia Fed early benchmark measure of NFP (pink), Civilian Employment (tan), real wages and salaries deflated by national chained CPI (sky blue), GDP (red), coincident index (green), all in logs 2021M11=0. Lilac shading denotes the 6 months after the WMC Winter survey. Source: BLS, BEA, Philadelphia Fed [1], [2], and author’s calculations.


