Conventional and Instantaneous
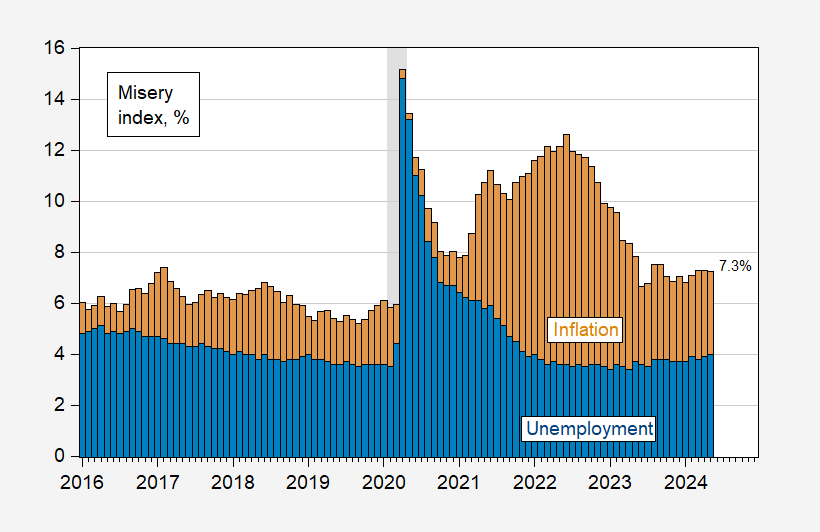
The unweighted average of unemployment rate and inflation rate is ad hoc. Here’s the conventional using y/y CPI:
Figure 1: Unemployment rate (blue bar) and y/y CPI inflation (tan bar), in %. NBER defined peak-to-trough recession dates shaded gray. Source: BLS, NBER, and author’s calculations.
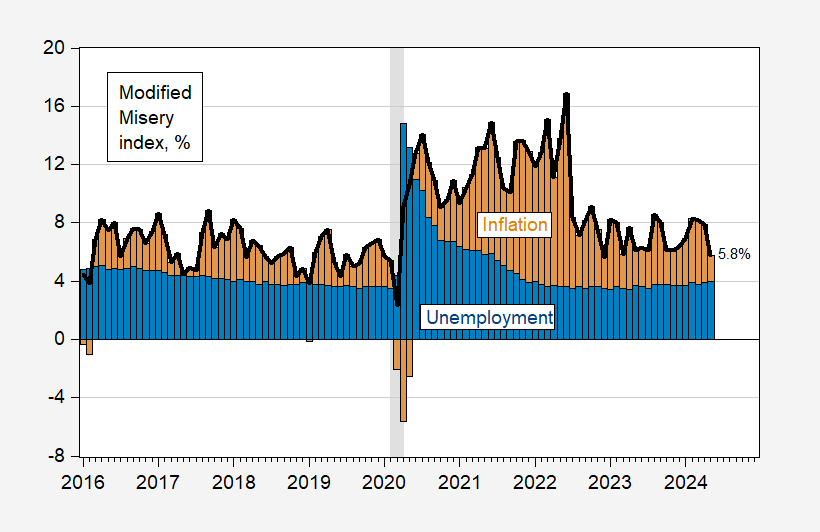
The use of y/y inflation is arbitrary. Here’s a measure using instantaneous (per Eeckhout, 2023) inflation (T=12, a=4). (Equal weights on inflation and unemployment is also arbitrary; see here).
Figure 2: Unemployment rate (blue bar) and instantaneous (T=12,a=4) CPI inflation (tan bar), in %. NBER defined peak-to-trough recession dates shaded gray. Source: BLS, NBER, and author’s calculations.
Note that the modified Misery Index in May is only 5.8% vs. 7.3% conventional. 5.8% compares favorably against the January 2021 value of 9.4%. (the comparison is against 7.8% using the conventional measure displayed in Figure 1).
Which one better measures people’s perceptions? Using the Michigan sentiment measure, one finds that the conventional measure is slightly better than the modified at predicting (Adj. R2 is 0.38 vs. 0.26), but exhibits greater serial correlation.
Moreover, the modified Misery measure peaks in 2022M06 while the conventional peaks at 2020M04. The Michigan sentiment series troughs at 2022M06, while the Gallup confidence index troughs at July 1st, 2022, roughly the same time (Conference Board confidence troughs at 2020M08).


