Lewis/Mertens/Stock and Baumeister/Leiva-Leon/Sims weekly indicators, and Torsten Slok’s rundown.
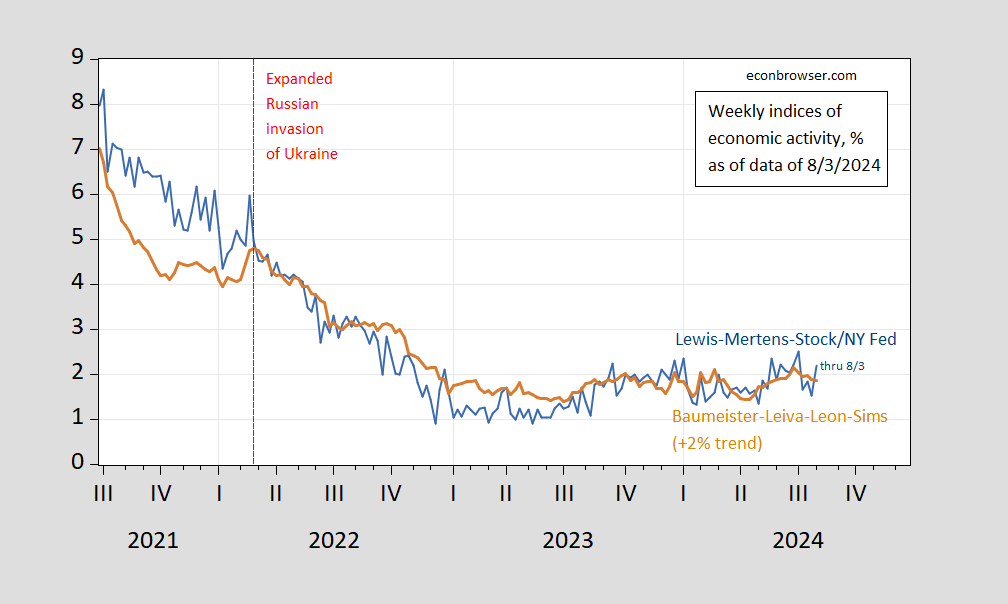
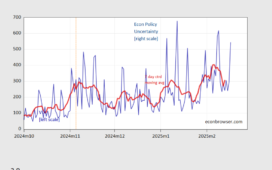
Figure 1: Lewis/Mertens/Stock Weekly Economic Index (blue), and Baumeister/Leiva-Leon/Sims Weekly Economic Conditions Index for US plus 2% trend (tan), all y/y growth rate in %. Source: NY Fed via FRED, WECI, accessed 8/10/2024, and author’s calculations.
Growth by both indicators is around trend.
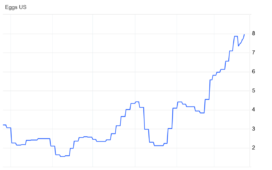
What did these series look like for the period surrounding the 2008 recession (keeping in mind these are the current vintages, not the real time versions):
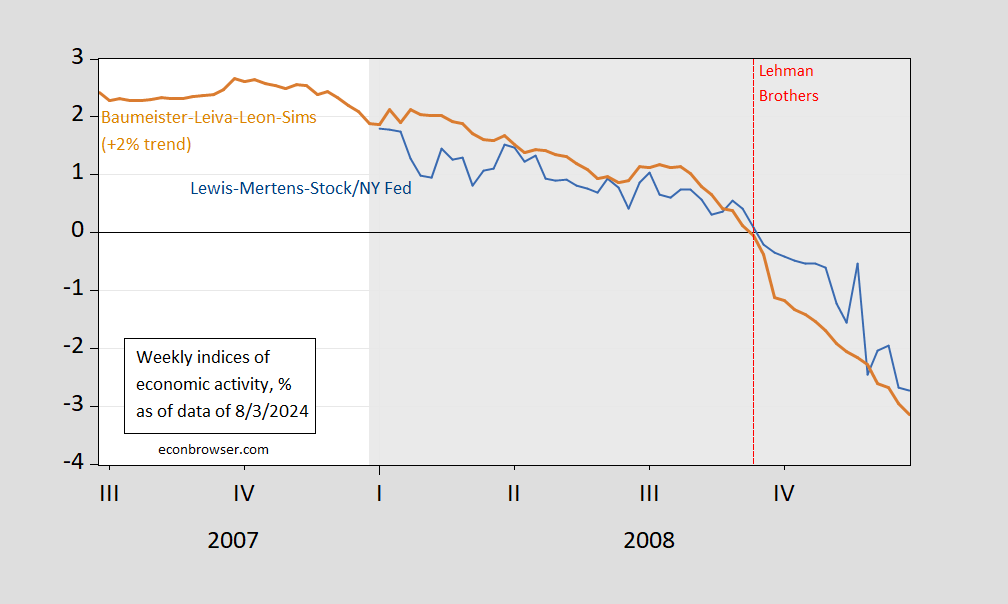
Figure 2: Lewis/Mertens/Stock Weekly Economic Index (blue), and Baumeister/Leiva-Leon/Sims Weekly Economic Conditions Index for US plus 2% trend (tan), all y/y growth rate in %. Source: NY Fed via FRED, WECI, accessed 8/10/2024, and author’s calculations.
So, comparing, it doesn’t look very recessionary for data available as of 8/3.
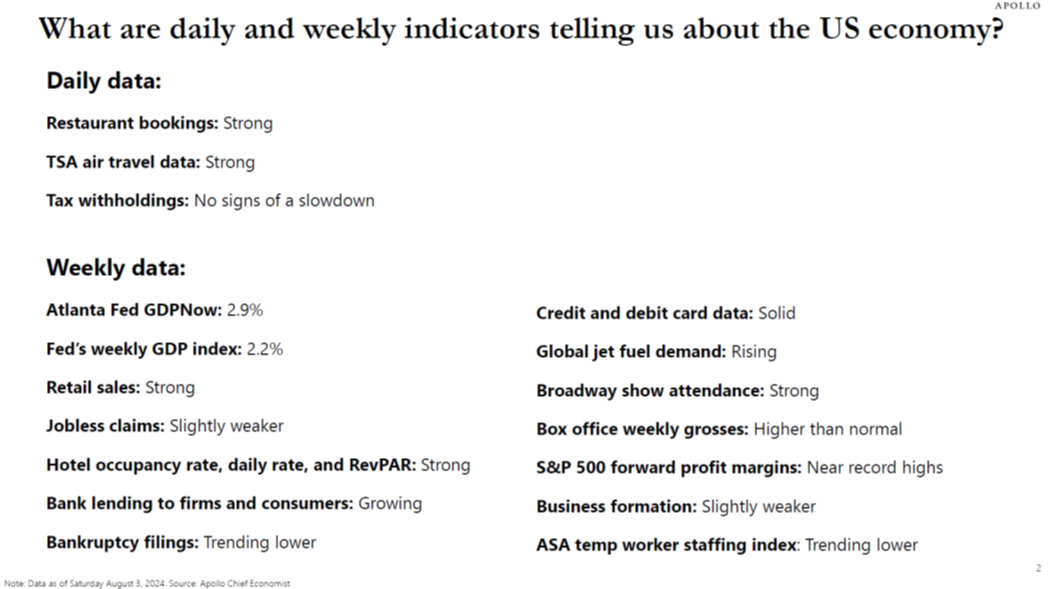
As promised, here’s Torsten’s summary of his Daily and Weekly Indicators for the US Economy chartbook (released today):