Today, we’re fortunate to have Willem Thorbecke, Senior Fellow at Japan’s Research Institute of Economy, Trade and Industry (RIETI) as a guest contributor. The views expressed represent those of the author himself, and do not necessarily represent those of RIETI, or any other institutions the author is affiliated with.
China’s merchandise exports increased from $62 billion in 1990 to $3.6 trillion in 2022. In 1990, China’s exports equaled 1.9% of world exports and in 2022 its exports equaled 14.3% of world exports. China’s export juggernaut threatens firms and jobs in importing countries. How does the renminbi affect China’s exports?
Cheung et al. (2012) examined how Chinese aggregate exports deflated using the Hong Kong re-export unit value index responded to the IMF CPI-deflated real effective exchange rate and to export-weighted real GDP over the 1994-2010 period. Employing dynamic ordinary least squares (DOLS) estimation, they reported exchange rate elasticities that are correctly signed and statistically significant. These indicate that if the renminbi were 10% weaker, the steady state level of exports would be between 9% and 16% higher.
How Exchange Rates May Affect China’s Exports Now
Exchange rates may not affect China’s exports in recent years as they did during the period that Cheung et al. (2012) investigated. China’s export basket now includes many more advanced products such as machinery, electronics, chemicals, and vehicles than it did over the sample period that Cheung et al. investigated. As more sophisticated goods are harder to produce than simple goods, it is harder to find substitutes for these goods than it is for ubiquitous products. Since finding substitutes is harder, price elasticities should be lower for complex goods.
In addition, Jean et al. (2023) found that China in 2019 possessed a share of more than 50% of worldwide exports in 600 products. This was six times greater than the U.S. or Japan and more than twice as much as the European Union taken as a whole. They noted that when Chinese exporters have a dominant market share in a product, it is difficult for importers to find substitutes. This could cause the price elasticity of demand for goods where China is dominant to be lower.
On the other hand, more of the value-added of the products that China now exports comes from China. Xing (2021) documented the rise of Chinese brands producing cellphones. Branded firms receive more of the return from goods they produce than contract manufacturers do. In addition, McMorrow (2024) showed that much of the value-added going into Huawei’s laptops now comes from China. Ahmed et al. (2016) and de Soyres et al. (2021) presented evidence indicating that the impact of exchange rates on exports increases as more of the value-added of the product is produced within a country.
Time Series Evidence on China’s Export Elasticities
It is thus an empirical question whether exchange rates have a greater impact on China’s exports in recent years than they did in earlier years. Chen Chen, Nimesh Salike, and I are investigating this question. First we use DOLS estimation and quarterly data on China’s real exports to the world over the 1994Q4-2023Q3 sample period. The dependent variables include the Bank for International Settlements CPI-deflated real effective exchange rate and real GDP in OECD countries. Minimizing Dickey-Fuller t-statistics and examining Dickey-Fuller autoregressive statistics point to a break in the export series during the Global Financial Crisis. A dummy variable is set equal to one beginning in 2009Q2. The dummy variable is also interacted with a trend term and with the exchange rate.
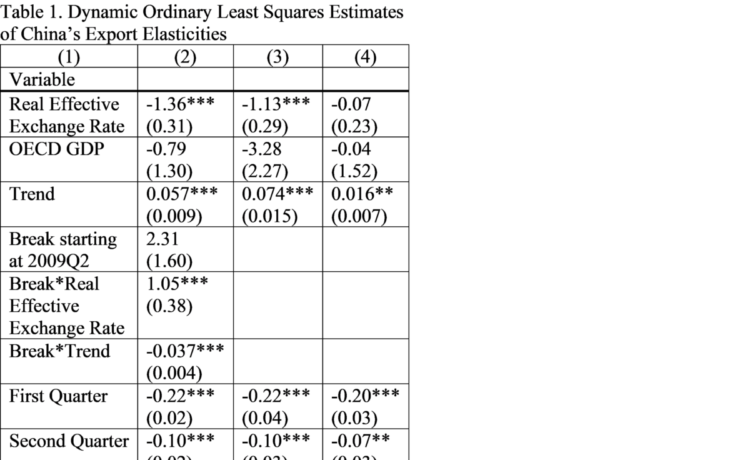
The results are presented in Table 1. Column (2) allows for a differential trend and for a change in the exchange rate elasticity beginning in 2009Q2. The coefficients on the real effective exchange rate and the real effective exchange rate interacting with a dummy variable equaling one starting in 2009Q2 are both highly statistically significant. They indicate that the exchange rate elasticity over the 1994-2009 period equaled −1.36 and over the 2009-2023 period −1.36+1.05 = −0.31. Thus a 10% renminbi appreciation would reduce exports by 13.6% over the earlier sample period and by only 3.1% over the later sample period.
Column (3) presents results over the 1994-2009 period. The exchange rate elasticity is correctly signed and greater than unity in absolute value. Column (4) presents results over the 2009-2023 period. The exchange rate coefficient is now insignificant and close to zero.
Panel Data Evidence on China’s Export Elasticities
One shortcoming of the approach reported in Table 1 is that we do not control for tariffs. We can do this using the methodology of Bénassy-Quéré et al. (2021). They explained annual disaggregated bilateral exports using a series of fixed effects, the bilateral real exchange rate between exporting and importing countries, the natural logarithm of one plus the bilateral tariff on a product, and other variables. We employ data on China’s bilateral real exports disaggregated at the Harmonized System four-digit level for 1,242 export categories to 190 countries over the 1995 to 2018 period.
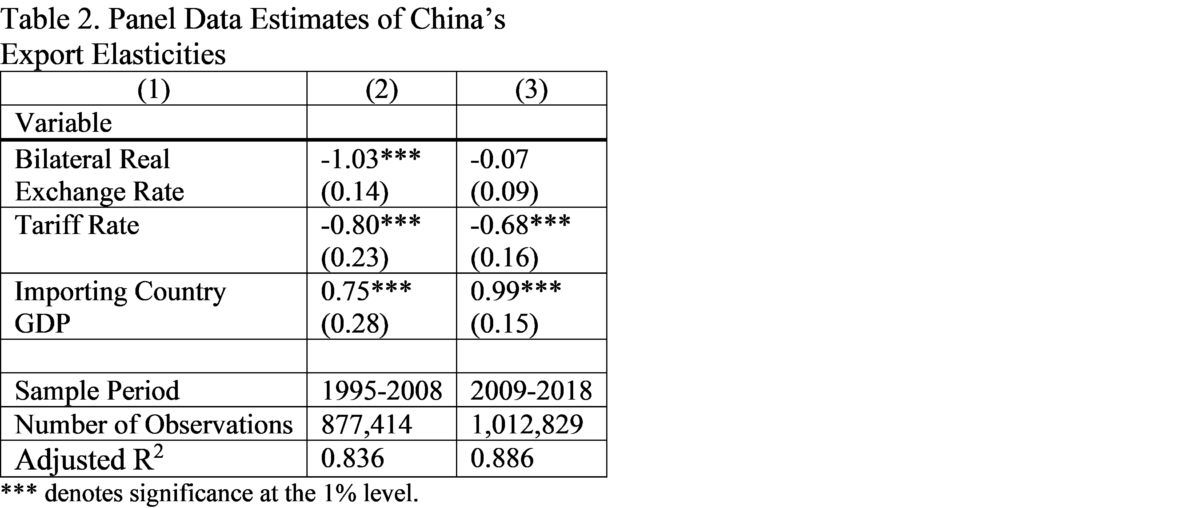
Table 2 presents the results over the 1995-2008 and 2009-2018 periods. Column (2) presents the results for the earlier sample period and column (3) for the later sample period. In the earlier period the coefficient on the exchange rate elasticity equals −1.03. This indicates that a 10% renminbi appreciation would reduce exports by 10.3%. The coefficient on the tariff rate equals −0.80. This indicates that a 10 percent increase in tariffs would reduce exports by 8 percent.
In the later period the coefficient on the exchange rate equals −0.07. This implies that the exchange rate does not affect Chinese exports over the 2009-2018 period. The coefficient on the tariff rate equals −0.68. This indicates that a 10 percent increase in tariffs would reduce exports by 6.8 percent.
We also investigate whether exchange rates impacted more sophisticated products differently over the later period, using the method of Hidalgo and Hausmann (2009) to measure sophistication. We find that exchange rates did not impact exports either for simple or for complex products.
Conclusion
China’s exports have soared. Setser (2024) reported that China’s goods trade balance may be 50% higher than reported in the Chinese current account data. China’s export juggernaut has generated tariffs abroad. Exchange rate appreciations will not help to stabilize exports. Rather than stoking protectionism, to rebalance trade China should boost domestic consumption and countries like the U.S. with outsized budget deficits should pursue fiscal consolidation.
References
Ahmed, S., Appendino, M., Ruta, M. 2015. Global Value Chains and the Exchange Rate Elasticity of Exports. IMF Working Paper No. 15–252, International Monetary Fund, Washington DC.
Bénassy-Quéré, A., Bussière, M., Wibaux, P. 2021. Trade and Currency Weapons. Review of International Economics 29, 487-510.
Cheung, Y., Chinn, M., Qian, X. 2012. Are Chinese Trade Flows Different? Journal of International Money and Finance 31, 2127-2146.
de Soyres, F., Frohm, E., Gunnella, V., Pavlova, E. 2021. Bought, Sold and Bought Again: The Impact of Complex Value Chains on Export Elasticities. European Economic Review 140, Article Number 103896.
Hidalgo, C., Hausmann, R. 2009. The Building Blocks of Economic Complexity. Proceedings of the National Academy of Sciences 106, 10570–10575.
Jean, S., Reshef, A., Santoni, G., Vicard, V. 2023. Dominance on World Markets: The China Conundrum CEPII Policy Brief No 44, CEPII, Paris.
McMorrow, R. 2024. Huawei Laptop Reveals China’s Progress towards Tech Self-sufficiency. Financial Times, 24 September.
Setser, B. 2024. The IMF’s Latest External Sector Report Misses the Mark. Follow the Money Weblog, 26 August.
Xing, Y. 2021. Decoding China’s Export Miracle: A Global Value Chain Analysis. World Scientific, Singapore.
This post written by Willem Thorbecke.

