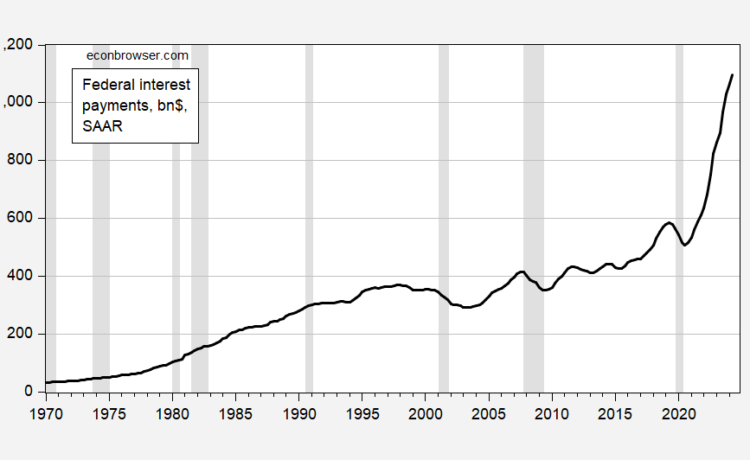
Ode to an EJ Antoni graph (apologies to Keats). Total interest payments have risen substantially, and this shows up in a scary picture:
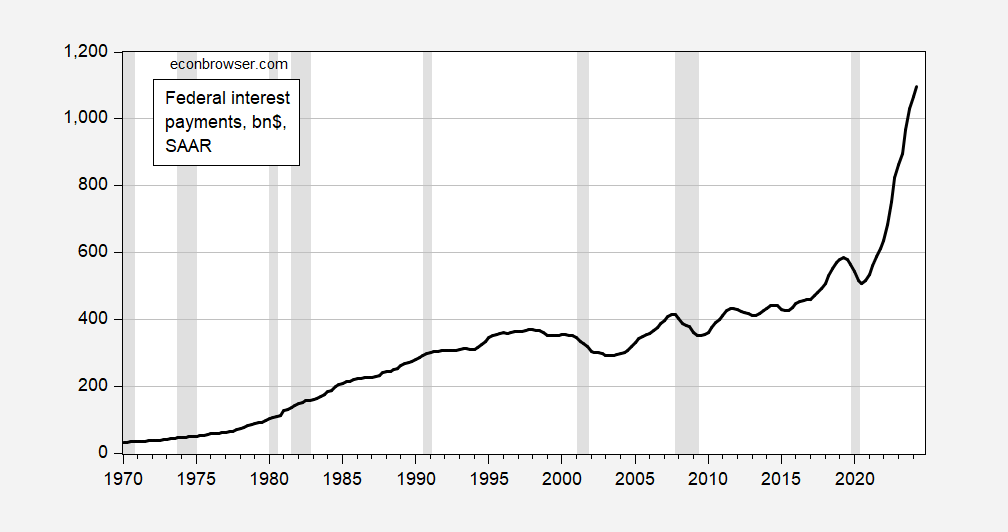
Figure 1: Federal interest payments, bn.$, SAAR (black). NBER defined peak-to-trough recession dates shaded gray. Source: BEA via FRED, NBER.
But maybe it’s useful to think about how our capacity to pay out of economic output has changed. Maybe we should look at Federal interest rate payments out of GDP (blue line below).
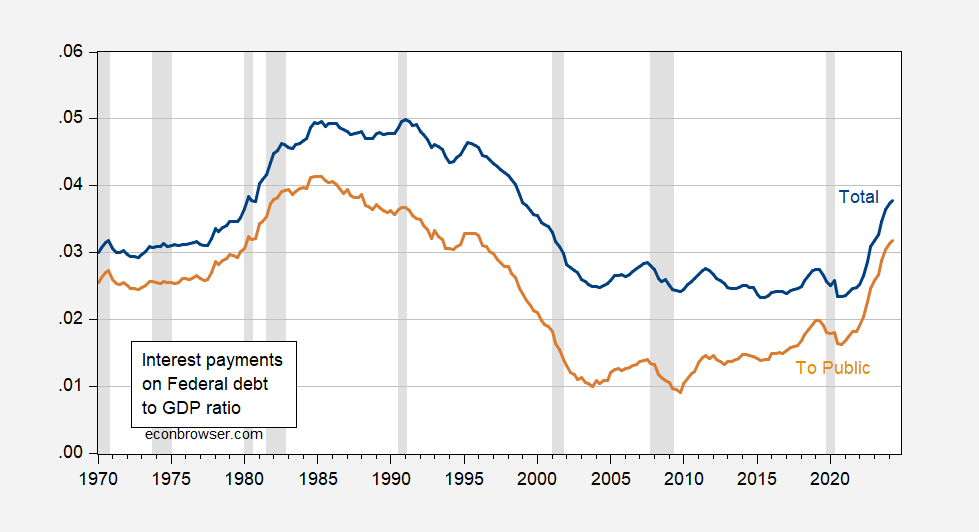
Figure 2: Federal interest payments as a share of US GDP (blue), Federal interest payments to the Public as a share of US GDP (brown). Interest payments paid to public calculated by taking effective interest rates on Social Security debt a multiplying by debt not held by public, and subtracting from total Federal payments. NBER defined peak-to-trough recession dates shaded gray. Sources: BEA, NBER, Social Security Administration [1], [2].
And then, maybe we should consider how much of the interest payments are going to finance Social Security, rather than going out to the public.
Still a scary picture. however, it’s noteworthy to see how much interest payments rose as a share of GDP during the Trump administration, even with low interest rates. We were back to GW Bush years before the pandemic. I’d say, time to raise some tax revenue, maybe some adjustments (not immolation) of Social Security, are in order.