Positive NFP employment surprise.
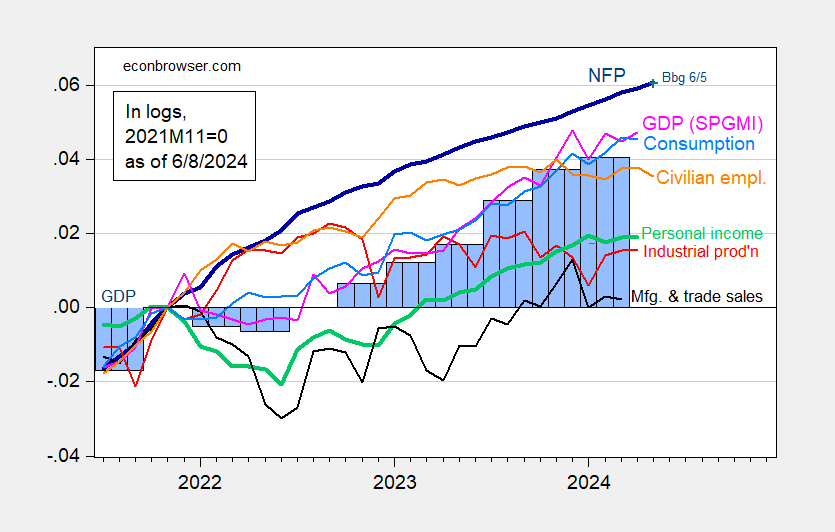
Figure 1: Nonfarm Payroll (NFP) employment from CES (bold blue), civilian employment (orange), industrial production (red), personal income excluding current transfers in Ch.2017$ (bold green), manufacturing and trade sales in Ch.2017$ (black), consumption in Ch.2017$ (light blue), and monthly GDP in Ch.2017$ (pink), GDP (blue bars), all log normalized to 2021M11=0. Source: BLS via FRED, Federal Reserve, BEA 2024Q1 second release, S&P Global Market Insights (nee Macroeconomic Advisers, IHS Markit) (6/1/2024 release), and author’s calculations.
As noted in previous posts, put almost all weight on the CES series, in assessing business cycle fluctuations.
Here are various employment series:

Figure 2: NFP employment (blue), Philadelphia Fed early benchmark (tan), CPS series adjusted to NFP concept (green), Business Employment Dynamics implied employment based on 2019Q4 level of NFP (pink), and aggregate hours (red), all seasonally adjusted, in logs 2021M11=0. Source: BLS, via FRED, Philadelphia Fed, and author’s calculations.
I’d downplay the CPS adjusted series, given the issues with population controls. The Business Employment Dynamics series gives pause, even while the Philly Fed early benchmark suggests continued growth, through December.
Addendum:
Here are a couple of alternative indicators, which have some indicative record: heavy truck sales, and the Sahm rule index.
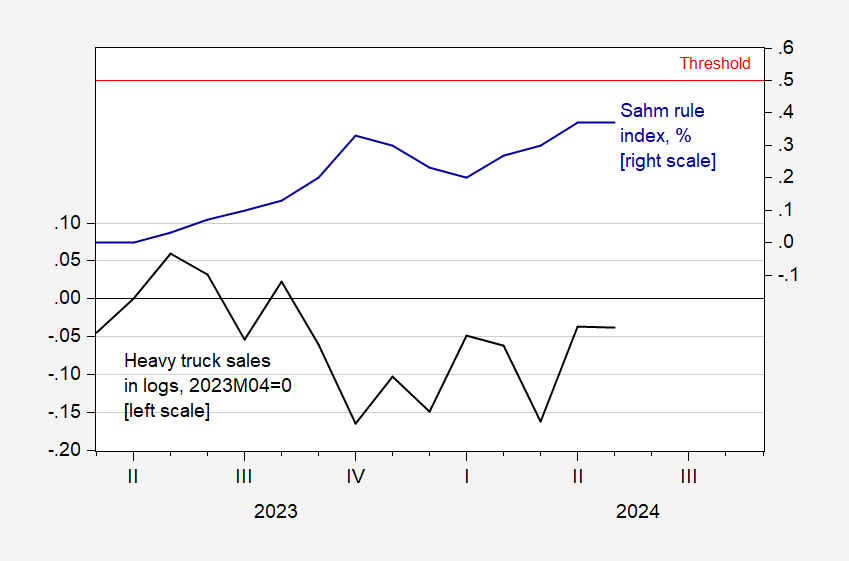
Figure 3: Heavy truck sales, s.a., in logs 2023M04=0 (black, left scale), and Real Time Sahm Rule index, % (blue, right scale), and 0.5% threshold (horizontal red line). Source: BEA via FRED, FRED, and author’s calculations.
One should take the Sahm rule measure as an conjunctural, rather than predictive, indicator. By this measure, we had not entered a recession as of May 2024.