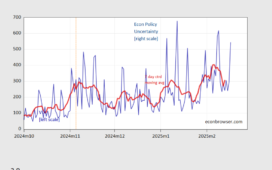
Change in NFP below consensus, but previous months upwardly revised. Big benchmark revision (-610 thousand), but even larger — 2 million upward — revision to December 2024 civilian employment.
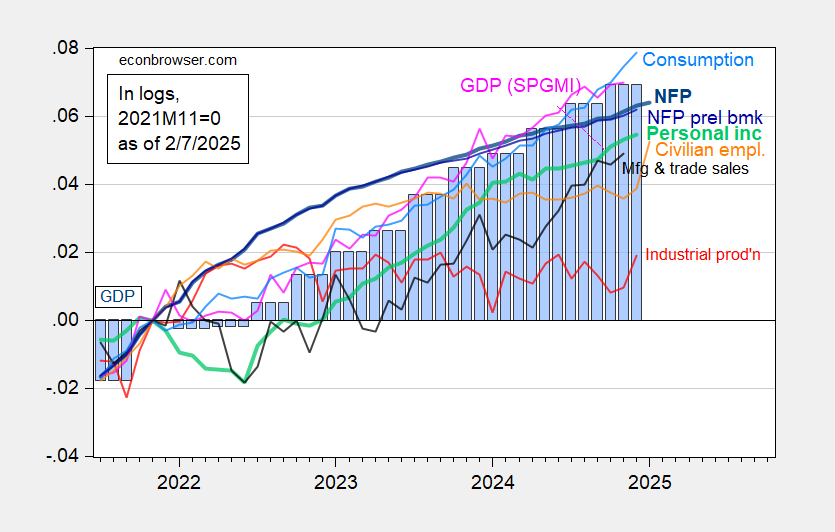
Figure 1: Nonfarm Payroll incl benchmark revision employment from CES (bold blue), implied NFP from preliminary benchmark through December (blue), civilian employment as reported (orange), industrial production (red), personal income excluding current transfers in Ch.2017$ (bold light green), manufacturing and trade sales in Ch.2017$ (black), consumption in Ch.2017$ (light blue), and monthly GDP in Ch.2017$ (pink), GDP (blue bars), all log normalized to 2021M11=0. Source: BLS via FRED, Federal Reserve, BEA 2024Q4 advance release, S&P Global Market Insights (nee Macroeconomic Advisers, IHS Markit) (1/2/2025 release), and author’s calculations.
As I noted in the last post, don’t take the trajectory of the civilian employment series literally, as new population controls have been applied for 2025, but not 2024. A more reasonable trajectory is to take the household series, applying implied controls using CBO estimates of immigration through mid-2024.
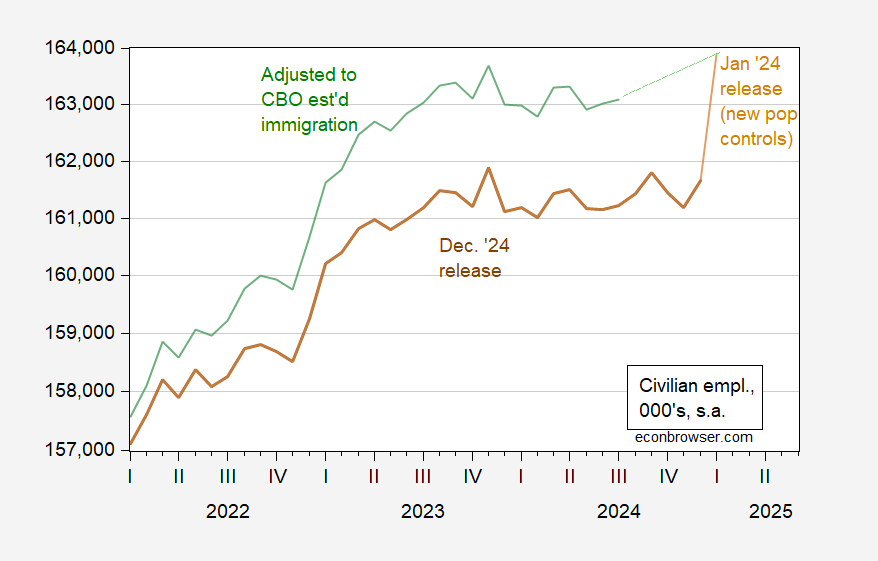
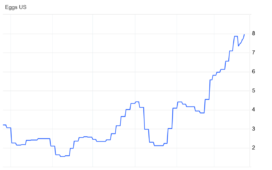
Figure 2: Civilian employment, December 2024 release (brown), January 2025 release, incorporating new population controls (tan), and previous civilian employment adjusted to CBO estimates of immigration, by author (green), all in000’s, s.a. Source: BLS via FRED, CBO, and author’s calculations.
Nowcasts for Q1 as of today are 2.7% (Atlanta Fed GDPNow) and 3.12% (NY Fed).