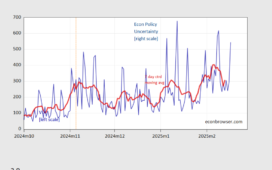
Here are key indicators followed by the NBER’s Business Cycle Dating Committee (top indicators employment and person income) plus monthly GDP from S&P (nee Macroeconomic Advisers nee IHS Markit):
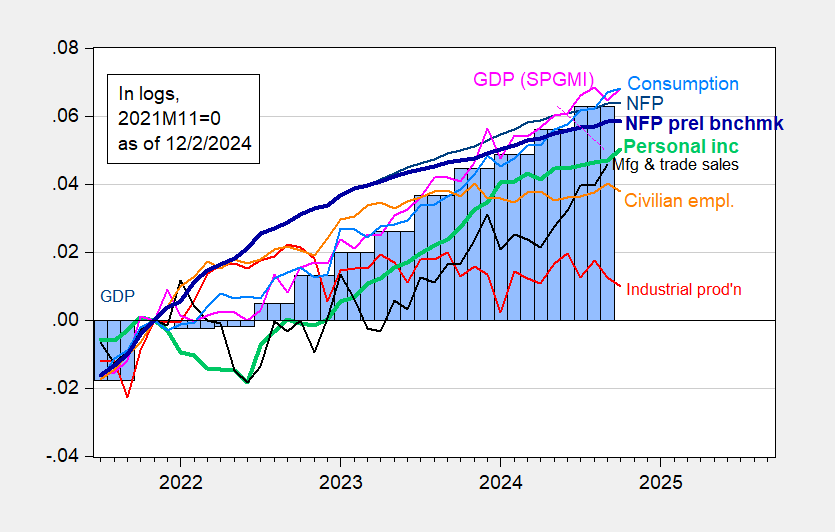
Figure 1: Nonfarm Payroll (NFP) employment from CES (blue), implied NFP from preliminary benchmark (bold blue), civilian employment (orange), industrial production (red), personal income excluding current transfers in Ch.2017$ (bold light green), manufacturing and trade sales in Ch.2017$ (black), consumption in Ch.2017$ (light blue), and monthly GDP in Ch.2017$ (pink), GDP (blue bars), all log normalized to 2021M11=0. Source: BLS via FRED, Federal Reserve, BEA 2024Q3 2nd release, S&P Global Market Insights (nee Macroeconomic Advisers, IHS Markit) (12/2/2024 release), and author’s calculations.
From S&P Global Market Insights:
Monthly GDP rose 0.3% in October, largely reversing a 0.4% decline in September that was revised from a previously reported 0.3% decline. The increase in monthly GDP in October was accounted for by a large increase in net exports. Final sales to domestic purchasers posted a small decline, while nonfarm inventory investment posted a small increase.
S&PGMI and Goldman Sachs tracking as of yesterday were 1.6% and 2.4%, respectively, for Q4, while GDPNow was 3.2%. NY Fed and St Louis Fed were at 1.9% and 1.31%, respectively, as of 11/29.