Consumption, personal income ex-transfers, and (for March) manufacturing and trade industry sales.
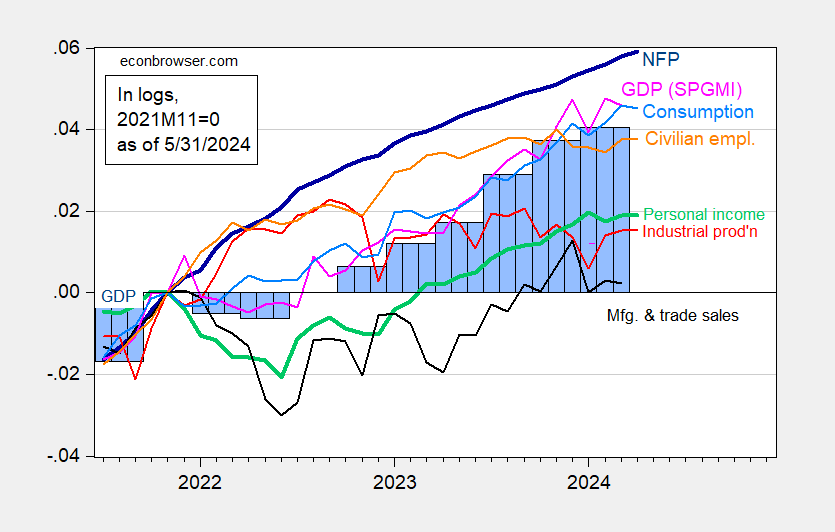
Figure 1: Nonfarm Payroll (NFP) employment from CES (bold blue), civilian employment (orange), industrial production (red), personal income excluding current transfers in Ch.2017$ (bold green), manufacturing and trade sales in Ch.2017$ (black), consumption in Ch.2017$ (light blue), and monthly GDP in Ch.2017$ (pink), GDP (blue bars), all log normalized to 2021M11=0. Source: BLS via FRED, Federal Reserve, BEA 2024Q1 second release, S&P Global Market Insights (nee Macroeconomic Advisers, IHS Markit) (5/1/2024 release), and author’s calculations.
Personal income and consumption show stabilization; consumption flat aligns with the downwardly revised GDP for Q1.