Apologies to Donald Rumsfeld. There is some uncertainty regarding what parts of presidential proposals will be implemented, especially in light of the necessity for Congressional approval. However, one area where legislative approval is not required: tariffs
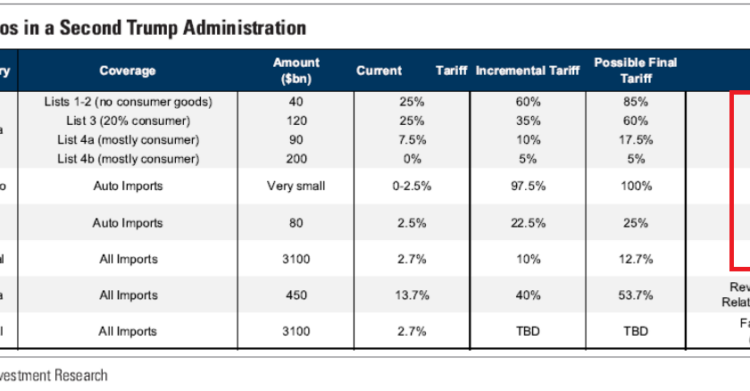
In the table below, see the items outlined in the red box.
Source: Alec Phillips, David Mericle and Tim Krupa, “The Election and the Economy,” (Goldman Sachs, 3 September 2024).
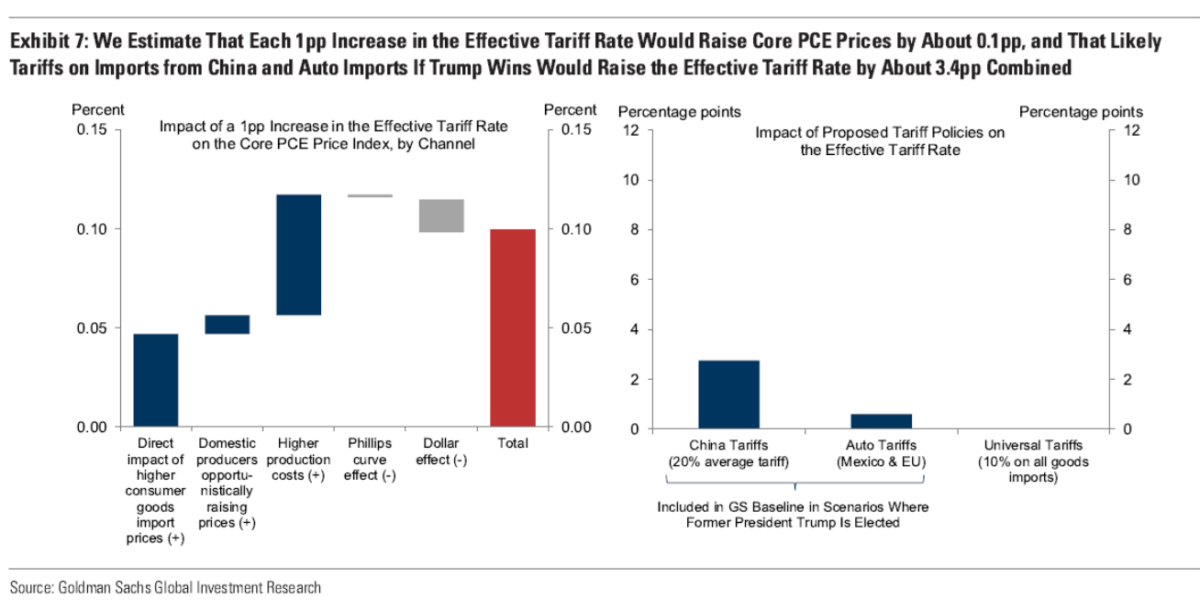
We have been down the Section 232 and Section 301 routes before (232 is national security, steel and aluminum last time around; 301 is market access, levied against China). Here’s the impact on effective tariffs on core PCE level.
Source: Alec Phillips, David Mericle and Tim Krupa, “The Election and the Economy,” (Goldman Sachs, 3 September 2024).
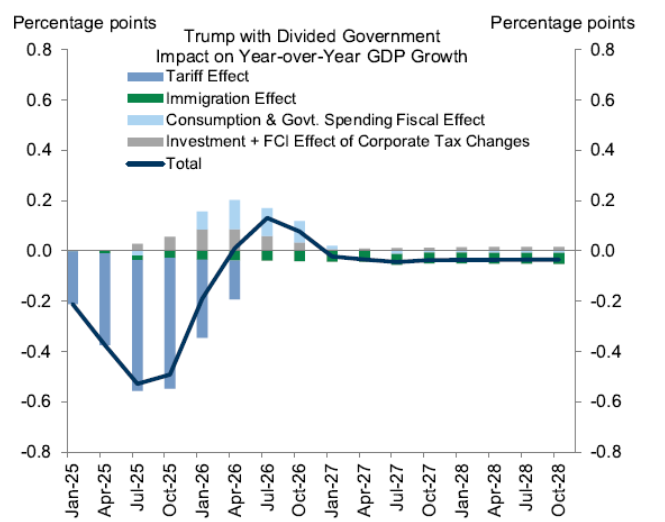
In terms of GDP, we can investigate the impact of base case for GDP, under divided government (that is, what Trump could do to tariffs without Congressional approval). See the blue bars in the below figure (all four scenarios are here).
Source: Alec Phillips, David Mericle and Tim Krupa, “The Election and the Economy,” (Goldman Sachs, 3 September 2024).
The overwhelming majority of the effect on GDP growth is due to tariffs – for which Trump 2.0 would not need Congressional authority.
What is yet more terrifying is that the analysis does not incorporate foreign country retaliation. If you don’t think there would be retaliation, then you’re smoking something… From Clausing and Obstfeld:
After the Trump Administration significantly increased tariffs on Chinese goods, China responded proportionately, reducing Chinese imports of US goods substantially.5 If countries throughout the world raise their own tariffs in response to Trump’s new tariffs, global economic headwinds will increase as the gains from trade diminish across the world. At the same time, higher import costs will entail upward price pressure, risking stagflation.
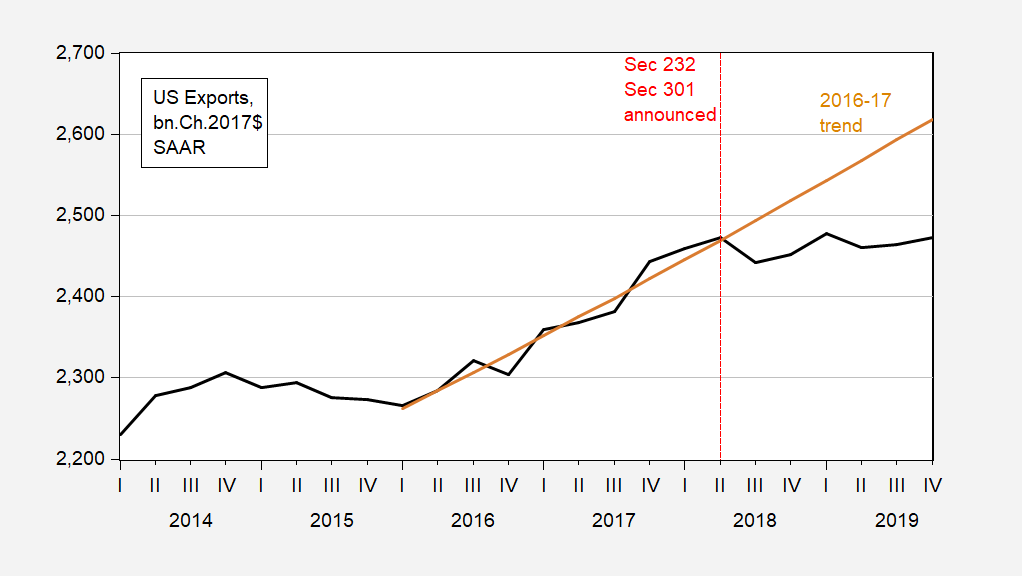
Here’s the picture of US exports of goods and services during the Trump administration (but before the pandemic-induced recession).
Figure 1: Exports of goods and services, bn.Ch.2017$ SAAR (bold black), 2016-17 log trend (tan). Source: BEA (NIPA), and author’s calculations.

