Growth in the first three years of Biden was 3.0%, vs 2.1% under Trump (pre-pandemic).
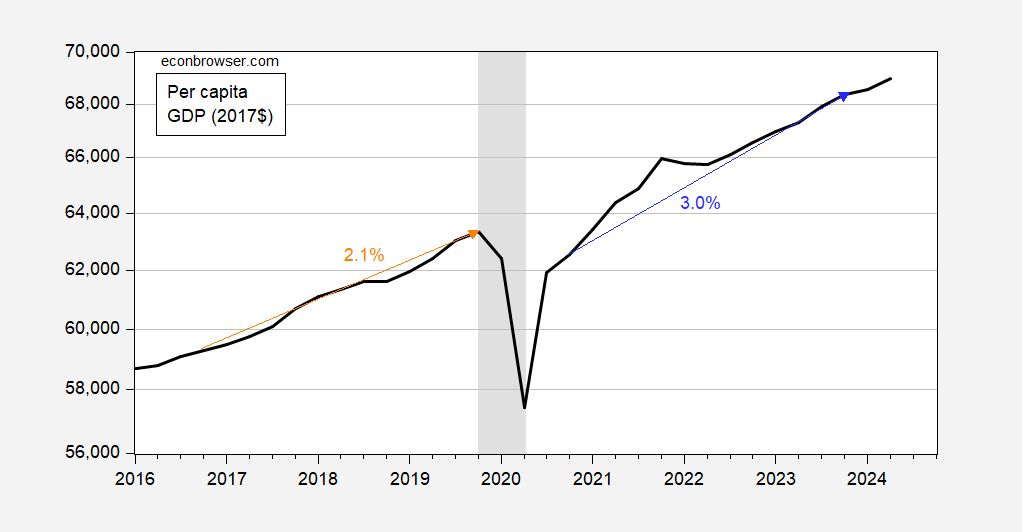
Figure 1: Per capita GDP in Ch.2017$ SAAR (black), on log scale. Orange arrow is average growth rate 2016Q4-2019Q4; blue arrow is average growth rate 2020Q4-2023Q4. NBER peak-to-trough recession dates shaded gray. Source: BEA 2024Q2 3rd release/comprehensive revision, NBER, and author’s calculations.